Benjamin S. Valle email: calmansys@yahoo.com
Process Stream Analyzers Training
Principles, Installation, Maintenance
The term Analyzer refers to any sensor that measures a physical property of the process material.
This could be a basic physical property (e.g., density or viscosity),
or product quality (e.g. octane, heating value).
The sensors are more complex compared with the standard
temperature, flow, pressure and level (T, F,P, and L) sensors.
Analyzers can be located on the process (stream) equipment to provide real-time
measurements of variables for use in plant operations and control.
A sample system is used to extract a representative sample of the fluid being analyzed.
Sampling System
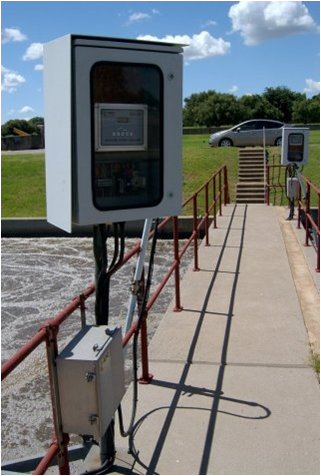
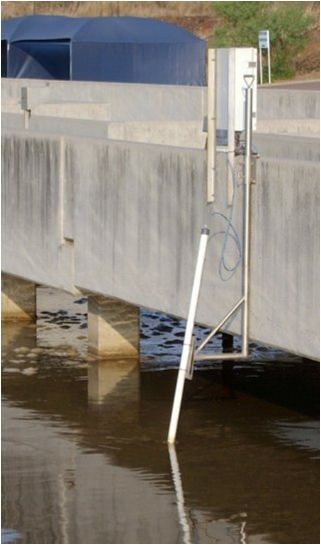
pH meter on Wastewater Treatment Plant
The pH probes are immersed on the wastewater tank. This installation is in situ.
No sampling system required.
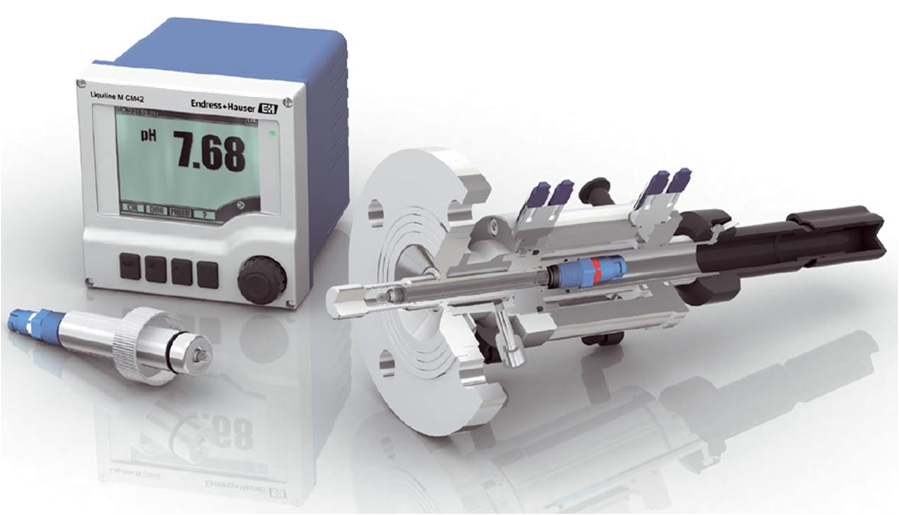
Inline pH probe installation
Inline analyzers has probes mounted directly on the process stream
so a sampling system is not required.
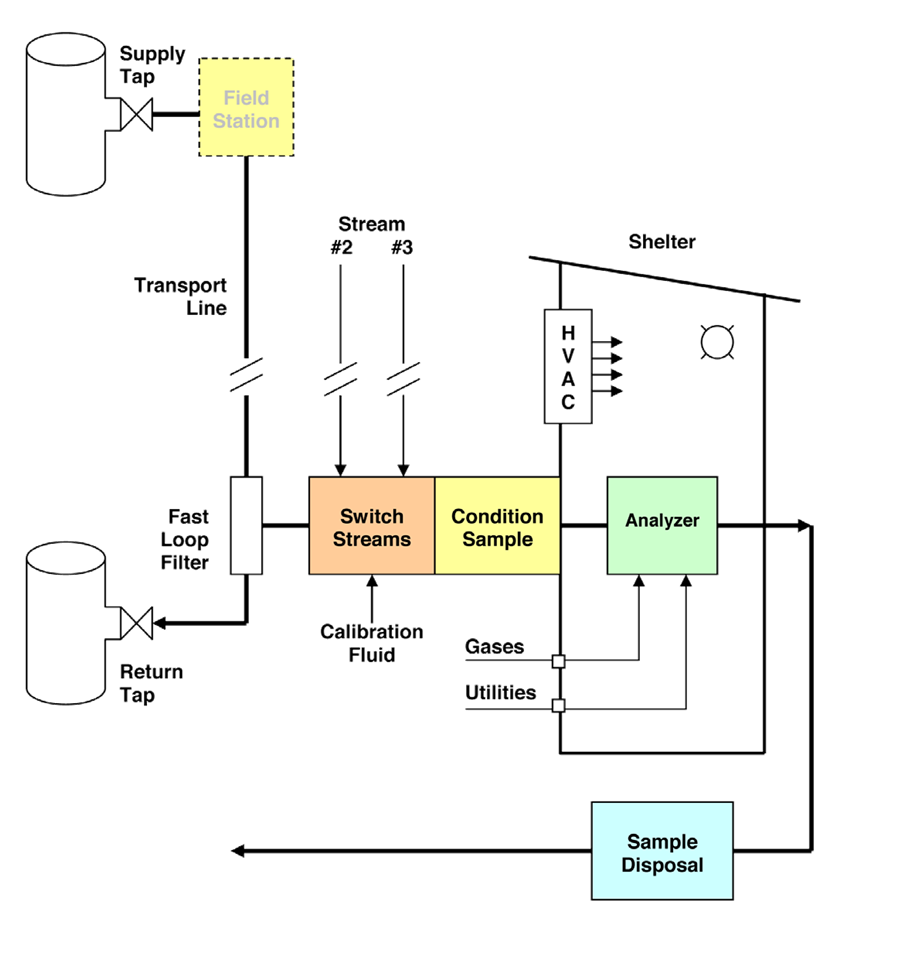
Complex analyzers such as a Gas Chromatograph or Gas Analyzer
must be installed in an Analyzer Shelter and needs a sampling system.
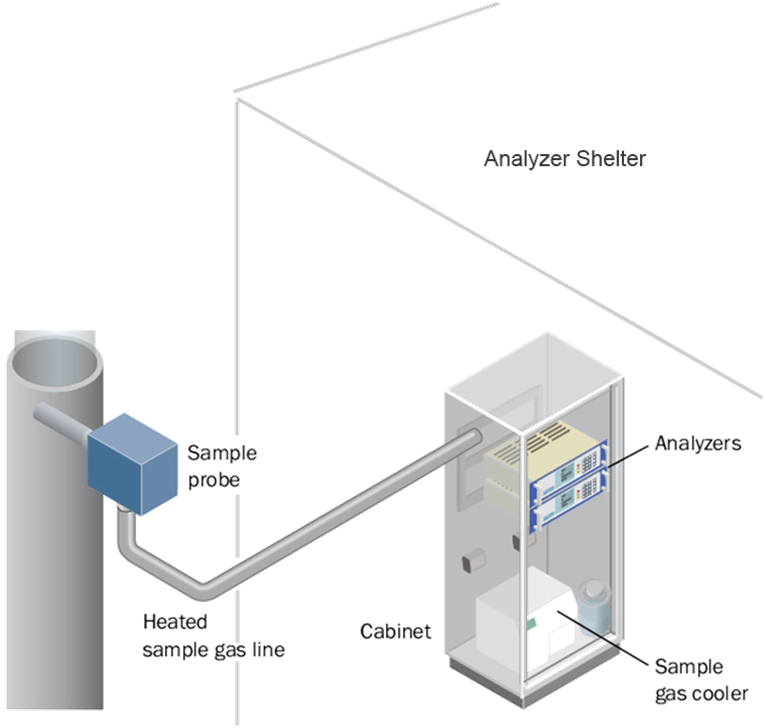
This is an extractive type of analyzer installation. A small amount of sample
is extracted from the process stream and transported to the analyzer shelter.
The shelter protects the sensitive electronics and measurement equipment.
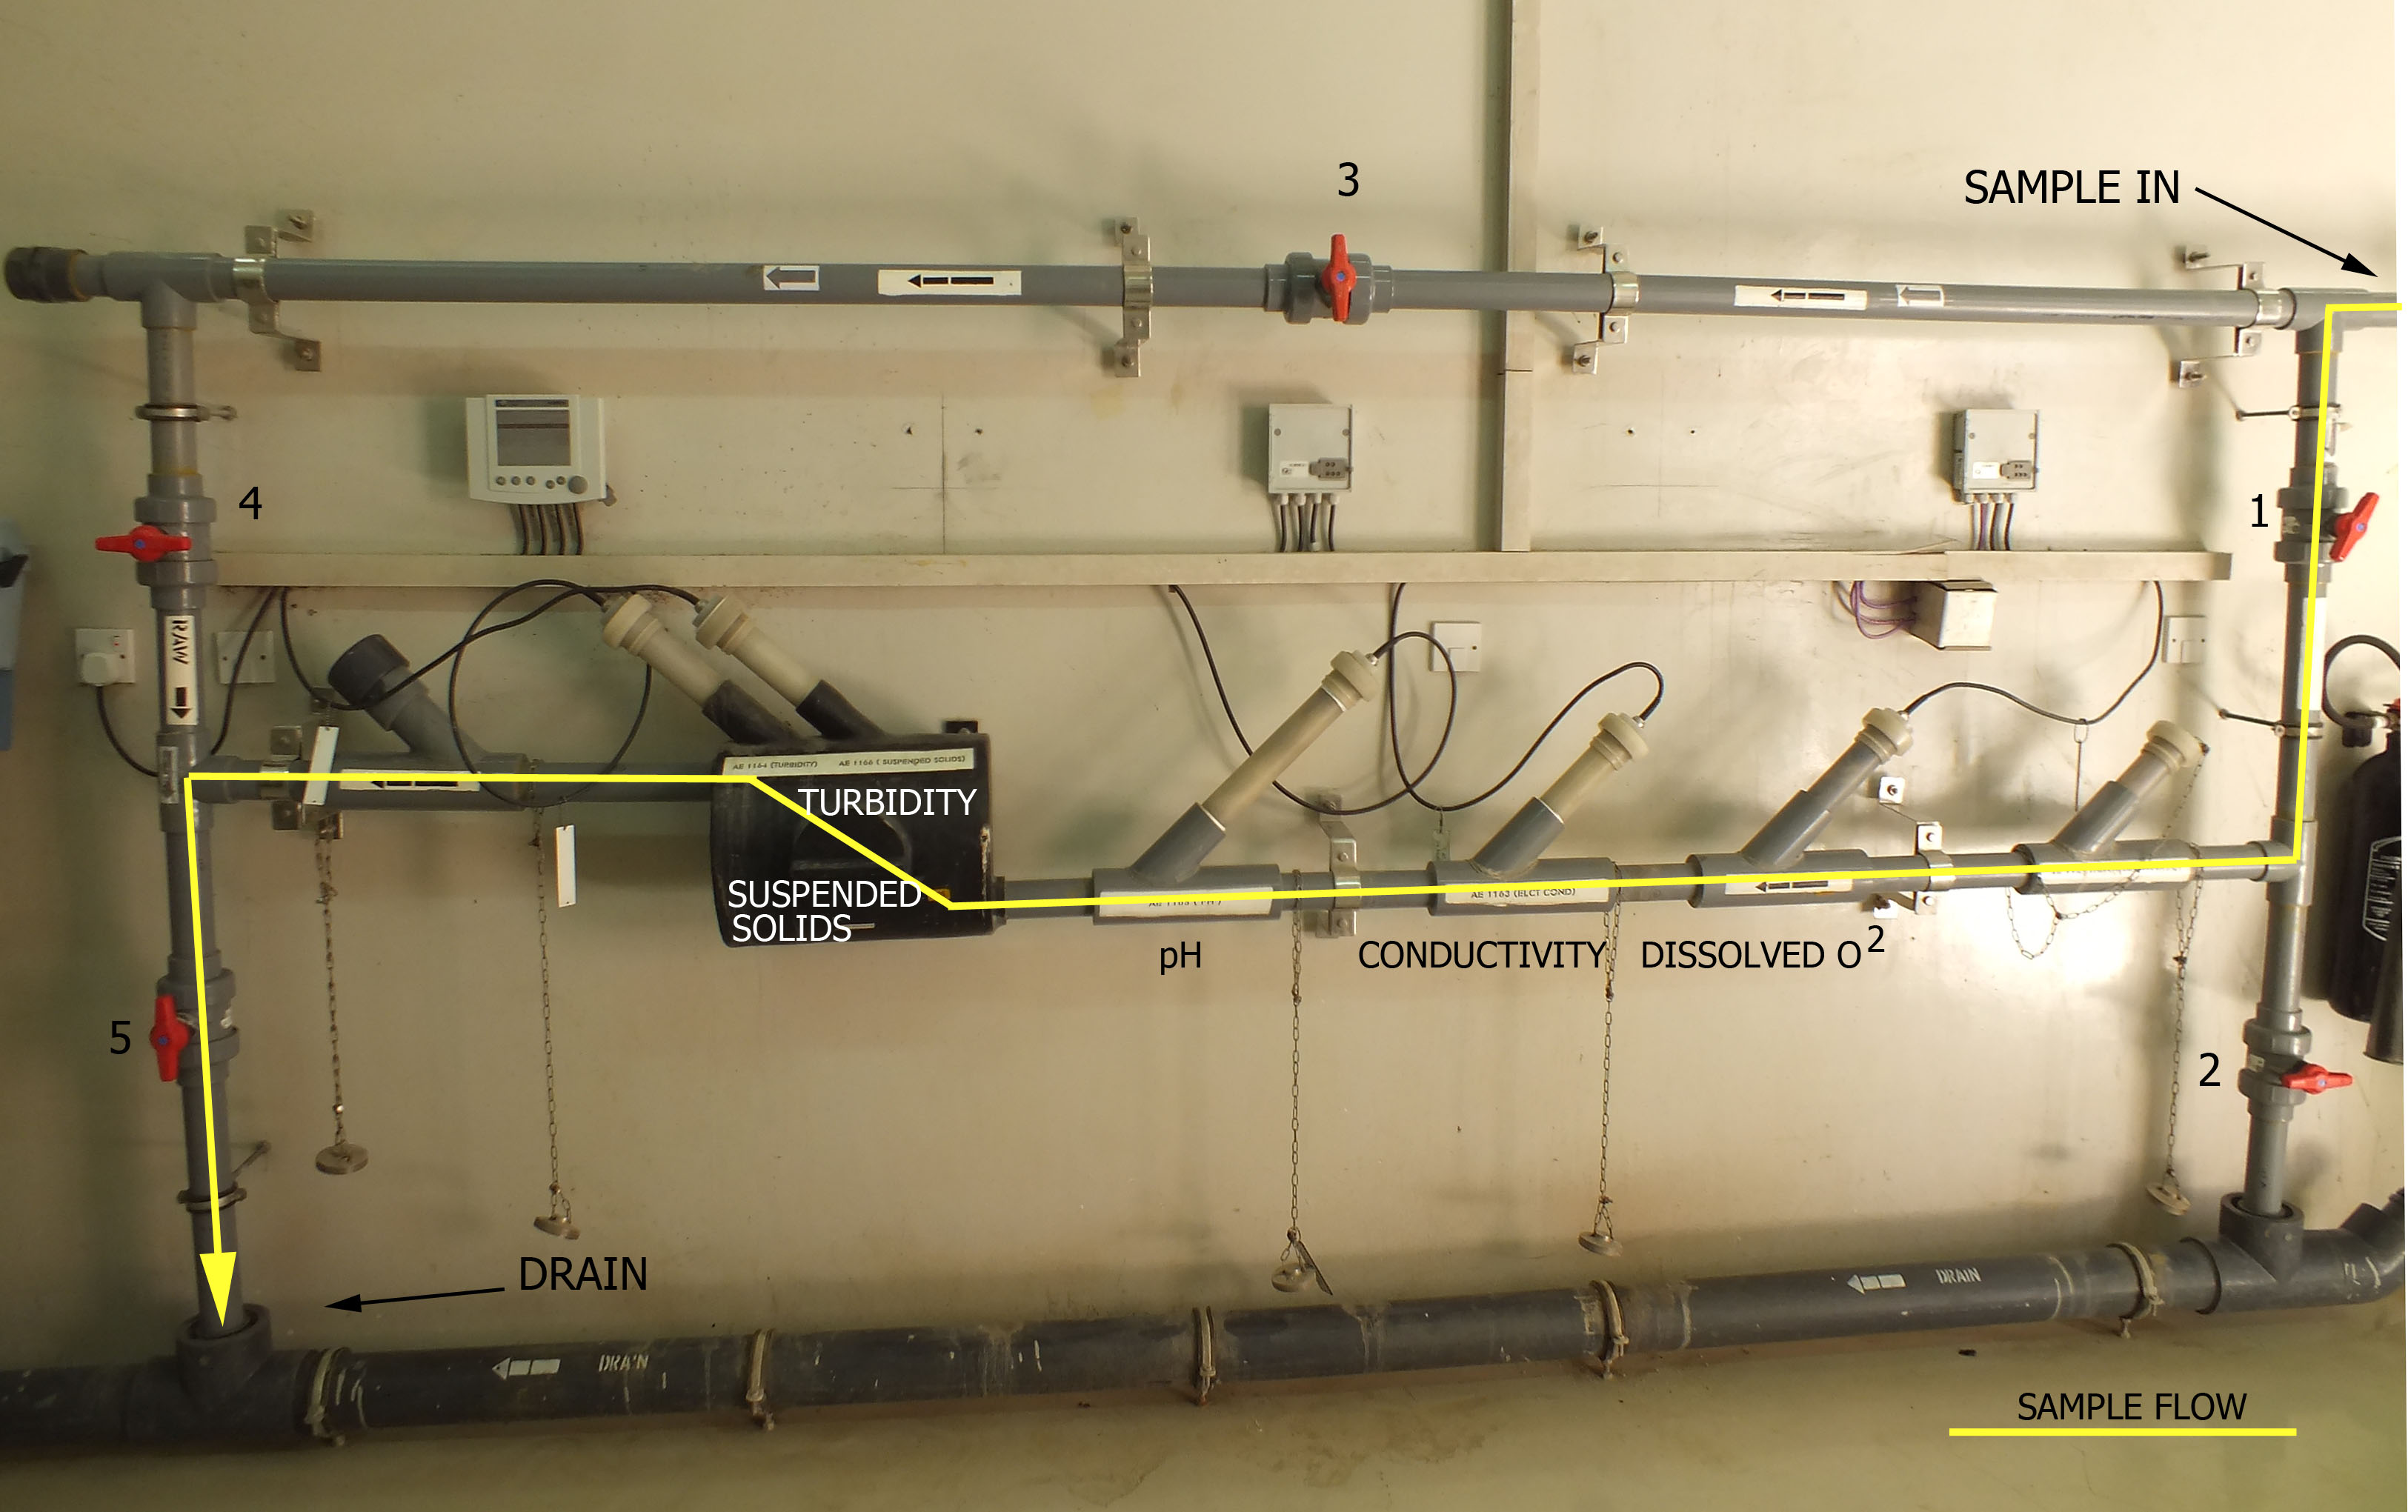
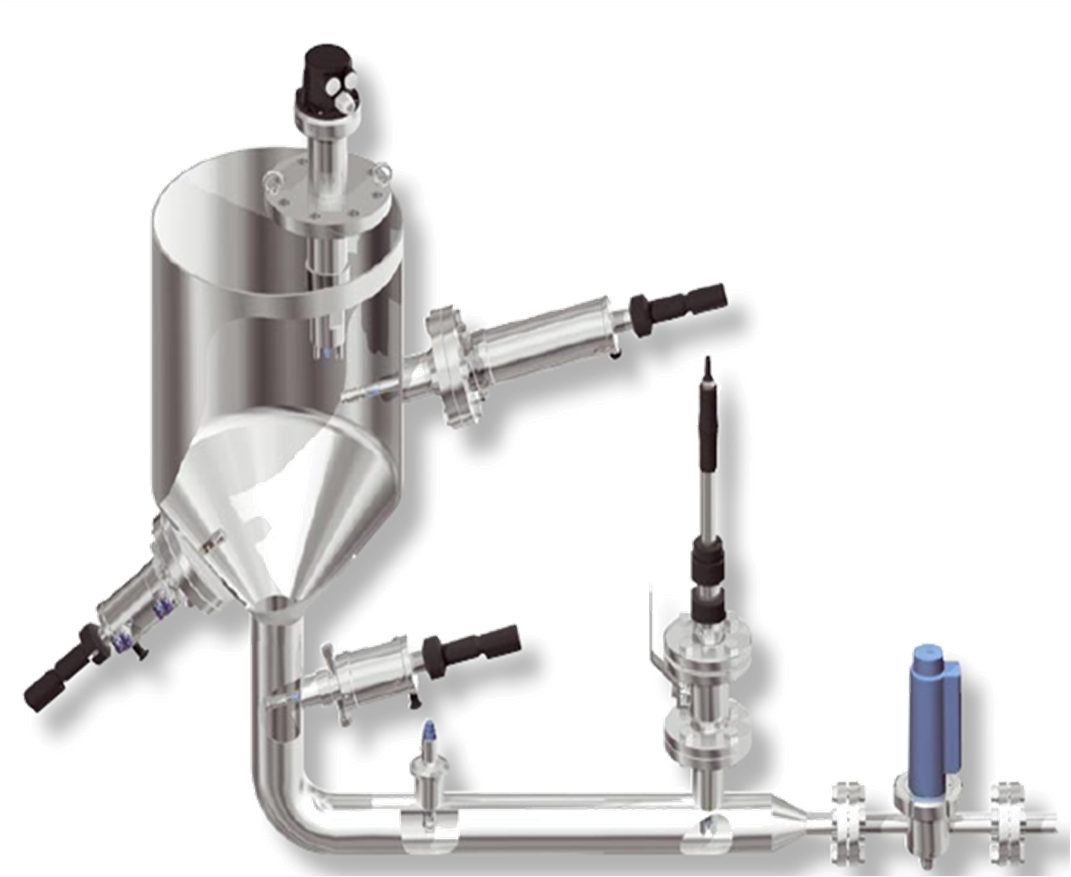
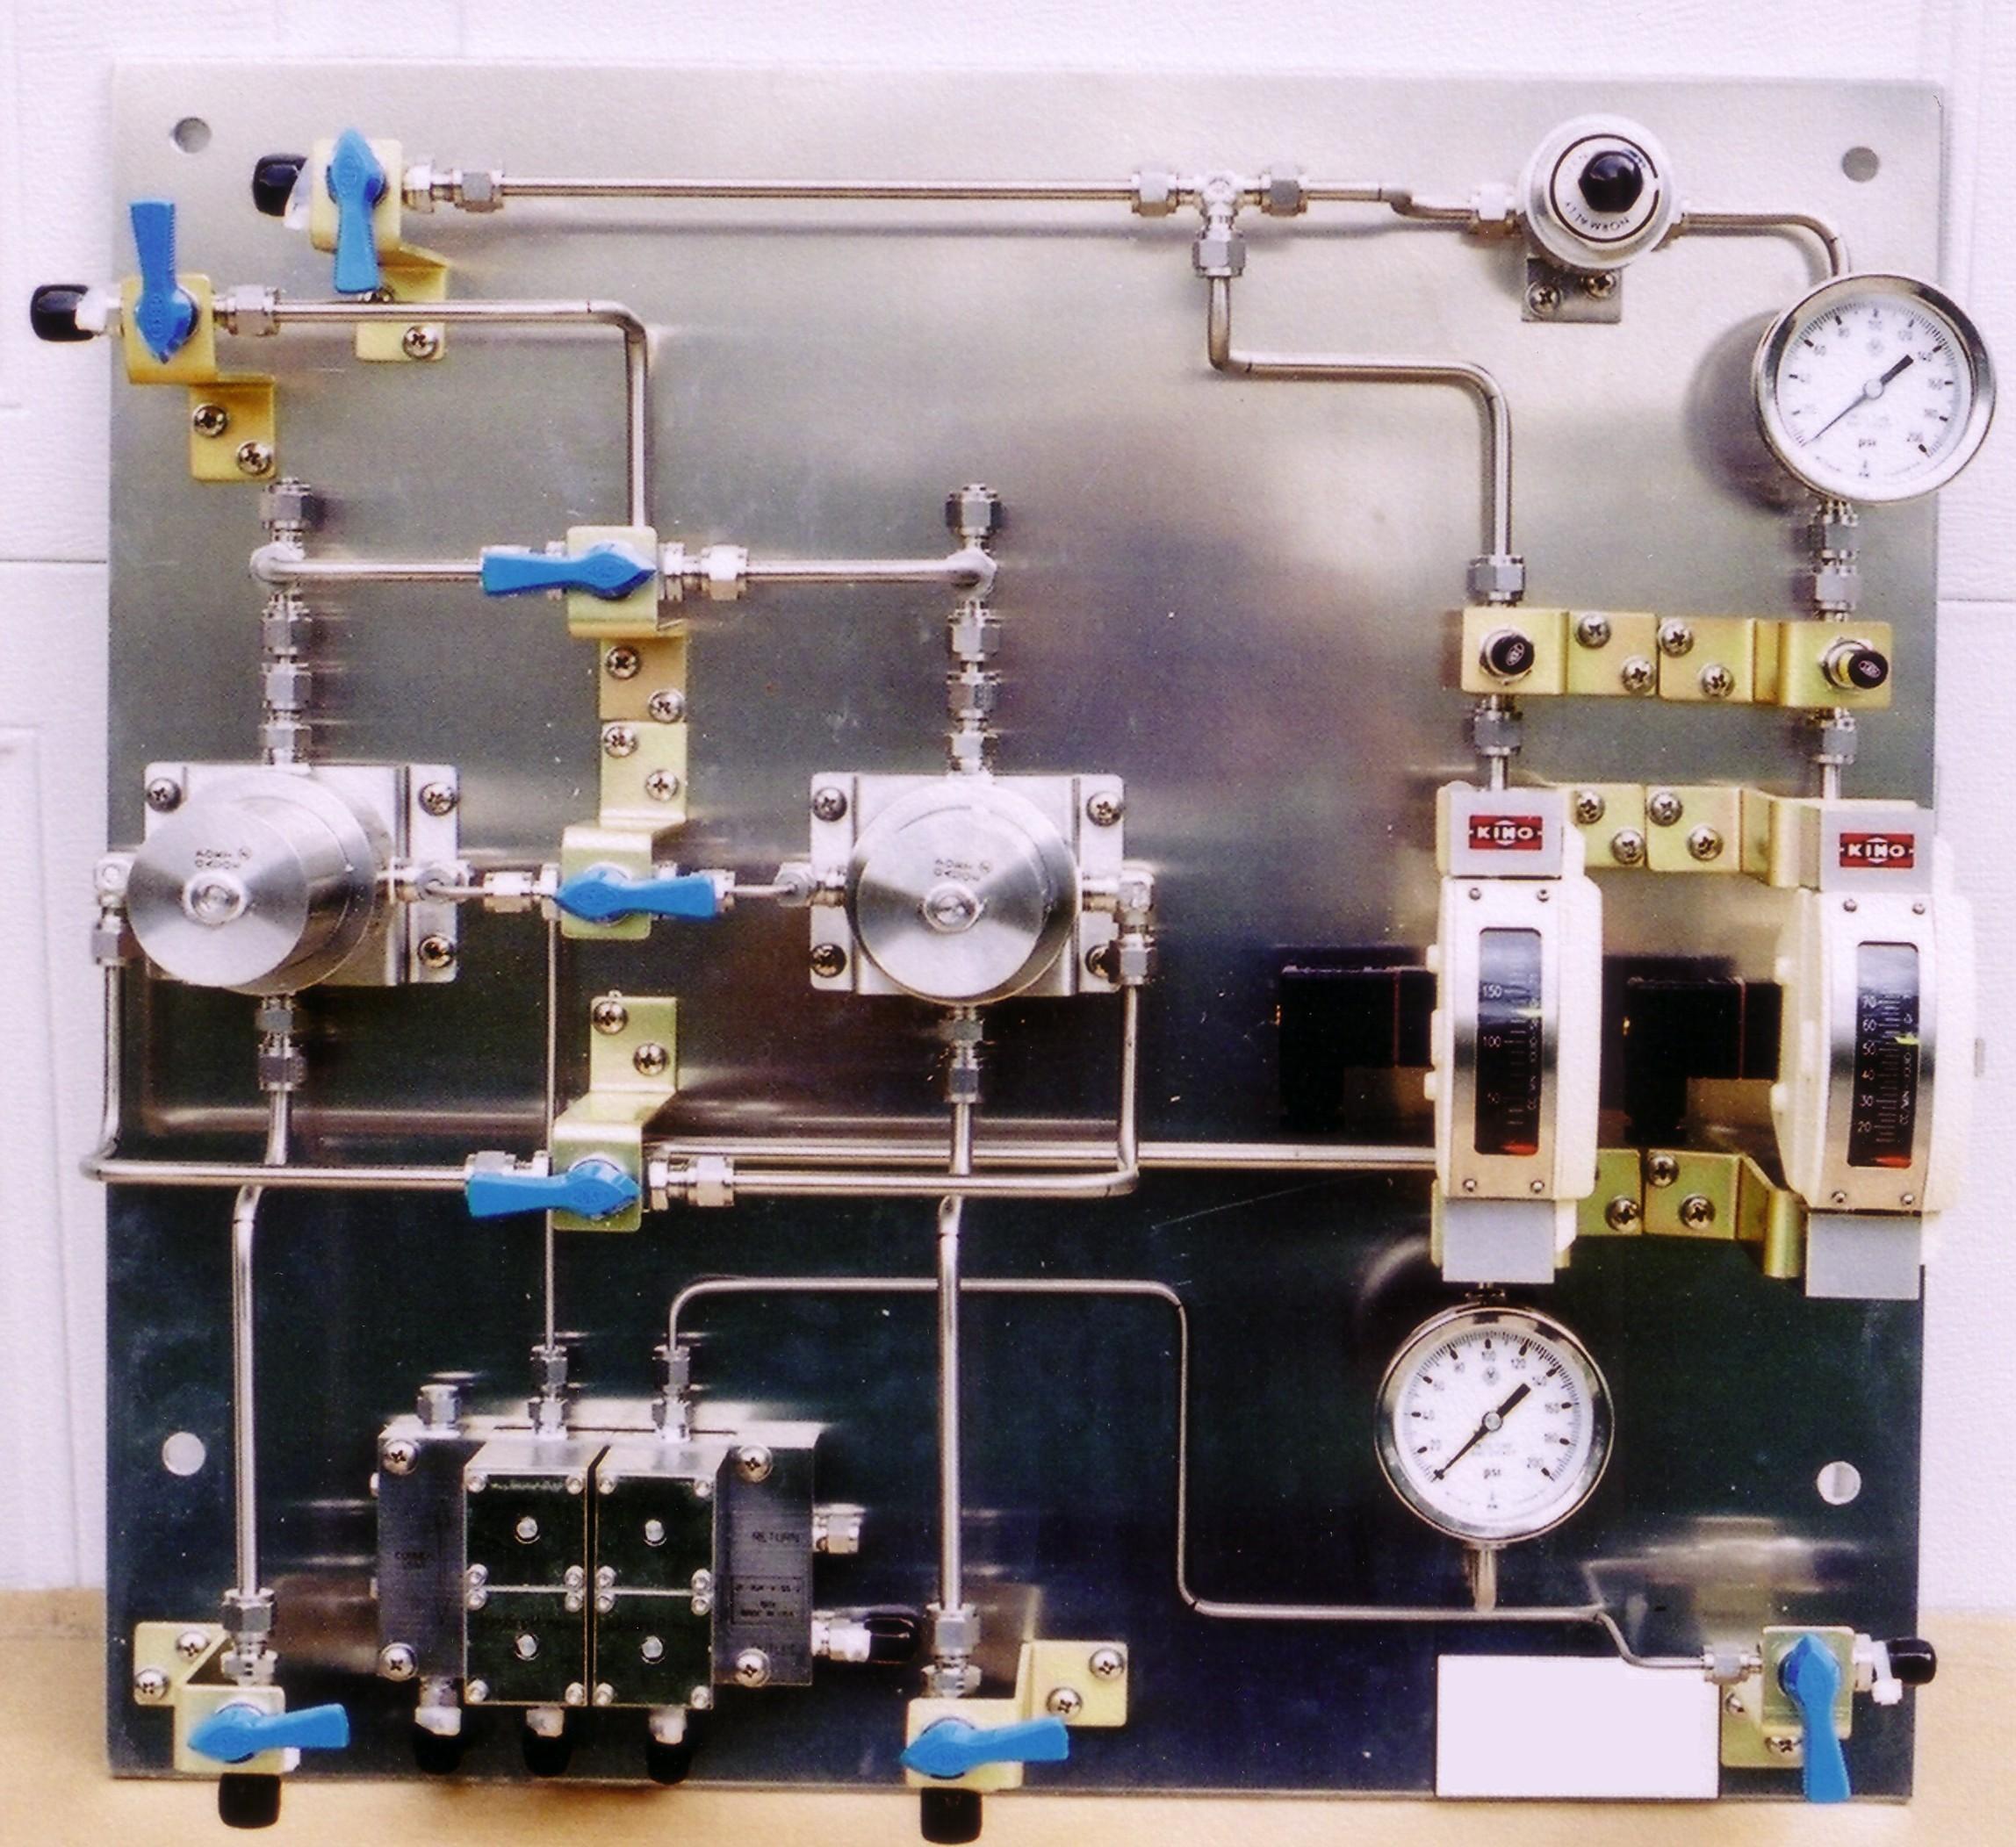
Wastewater Sampling System
1. Sample flows through valve 1 the isolating valve, partially throttled to control flow.
Valve 2 is used to flush the sample line to drain.
2.Sample passes through the sensors in this order:
a. Dissolved Oxygen
b. Conductivity
c. pH
d. Suspended Solids
e. Turbidity
3. Valve 3 is the bypass if fast loop flow is desired. Valve 4 isolates the sample system
from the process for maintenance. Valve 5 routes the sample to drain.

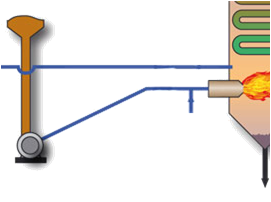
Due to safety reasons, monitoring of CO in coal bunkers and coal mills is an essential issue.
CO is an odorless and very toxic gas and imposes a serious
explosion threat at levels above CO Analyzer 8 vol.% in air.
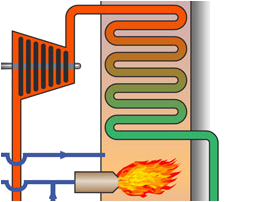
Combustion control incl. primary air
Supply of combustion air is a primary task in because it delivers the required amount of oxygen
which must be optimized and controlled carefully to ensure safe and efficient combustion,
to minimize fuel consumption as well as emission of pollutants
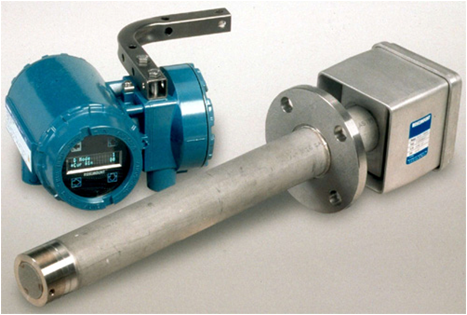
O2 Inline analyzers has probes mounted directly on the process stream so
a sampling system is not required.
The Objectives of Sampling System
1. compatibility with the analyzer ( required pressure, flow, temperature)
2. getting a timely response
3. providing a representative sample
4. to inject a test sample to the analyzer
5. proper sample disposal
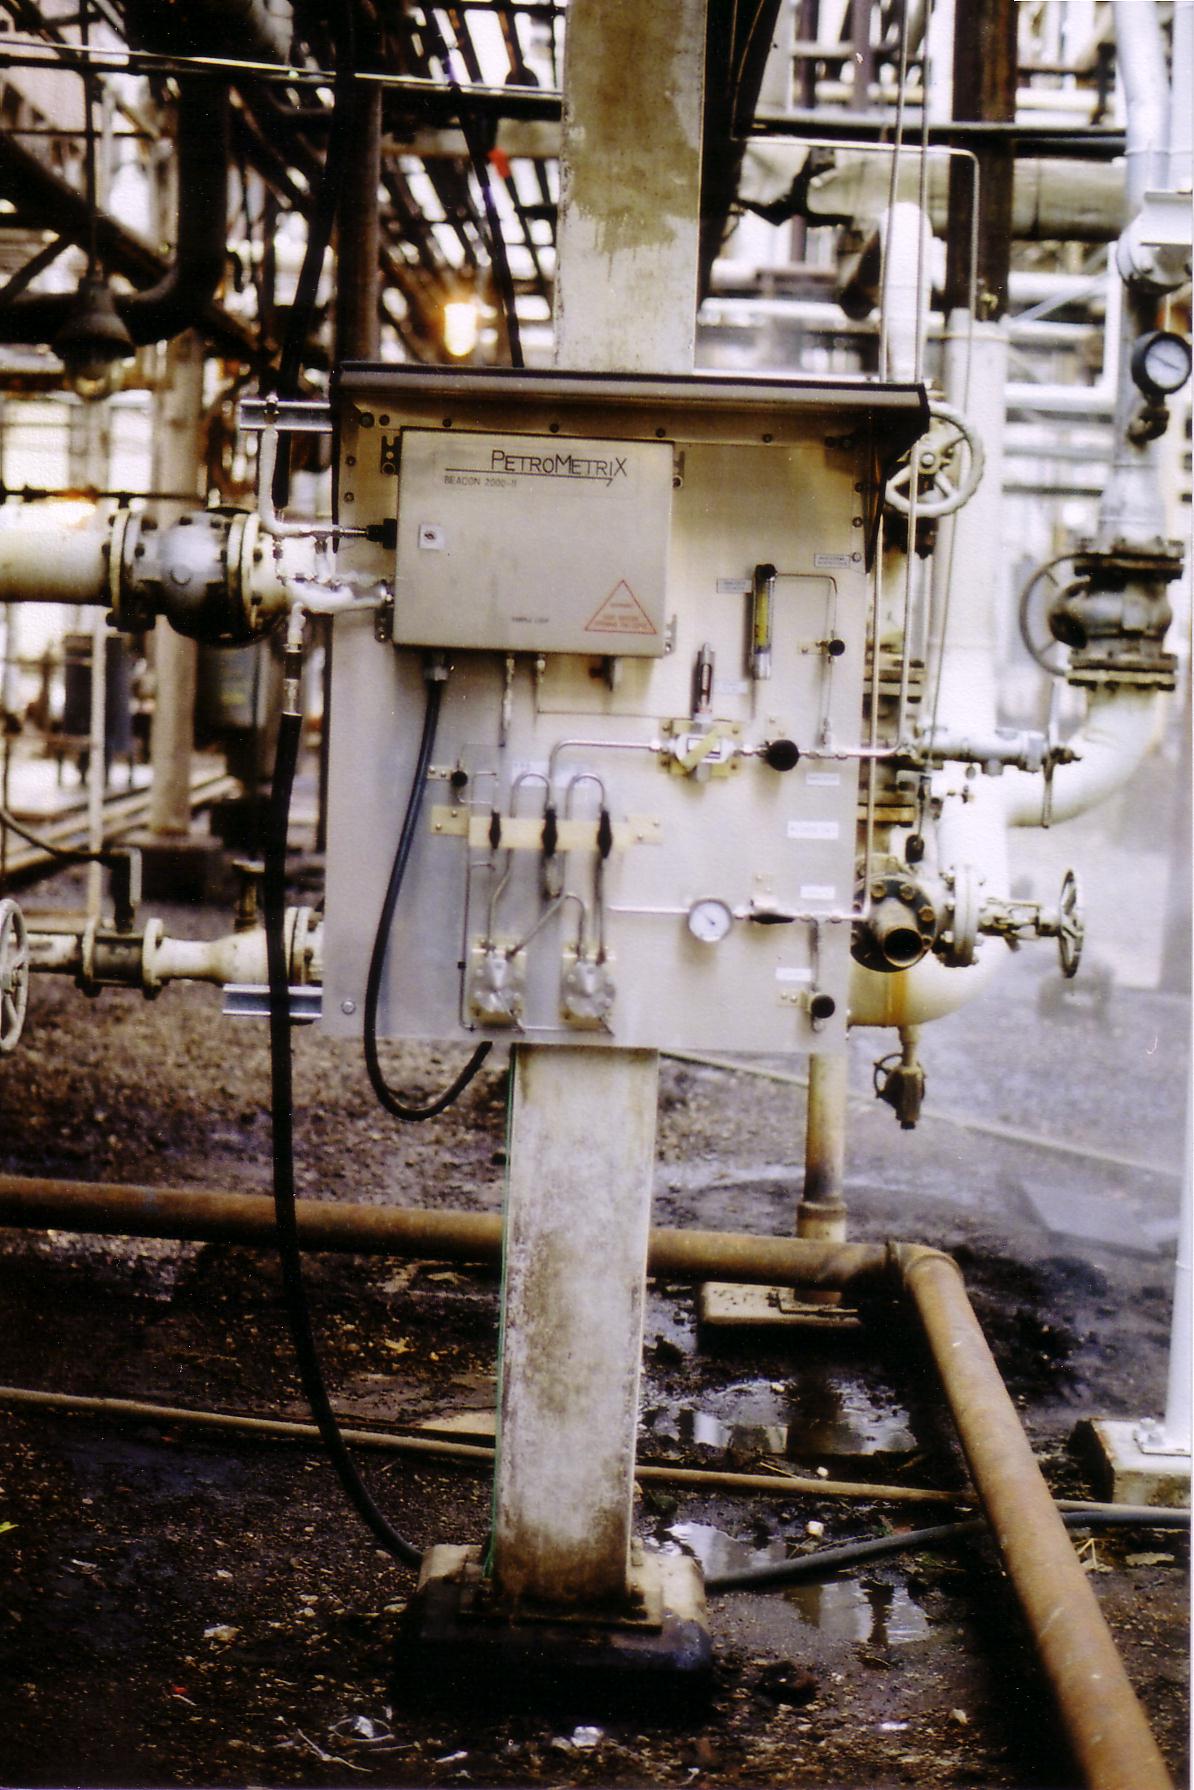
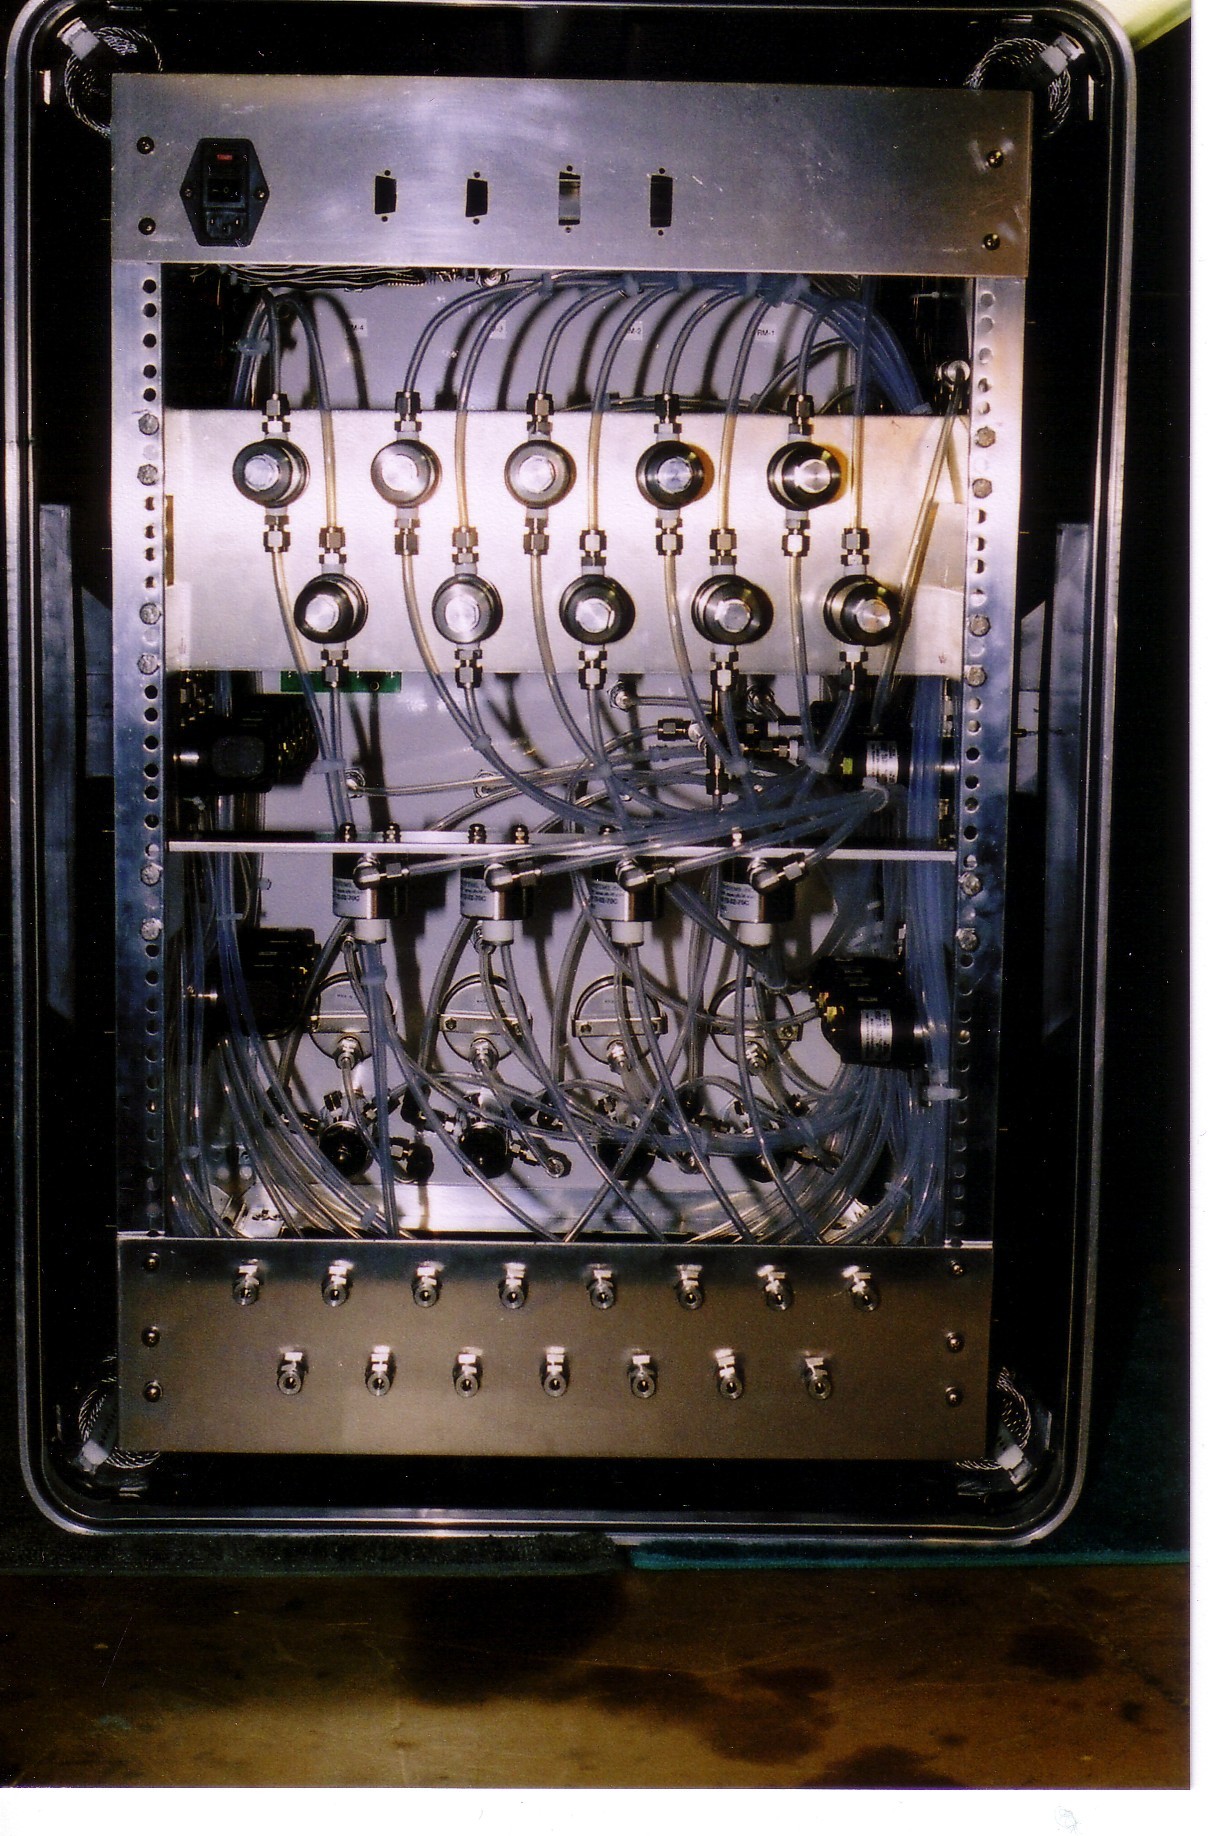
Analyzers installed in a 200,000 bpd Refinery
Three Types of Oxygen Sensing Technologies
1. PARAMAGNETIC
2. WET ELECTROCHEMICAL- Fuel Cell
3. DRY ELECTROCHEMICAL- Zirconium Oxide
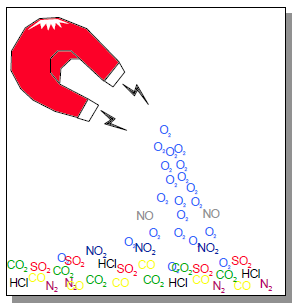
Paramagnetic Technology
Oxygen is unique.
It is strongly attracted into a magnetic field.
It is described as being “ paramagnetic ”
Paramagnetic Technology
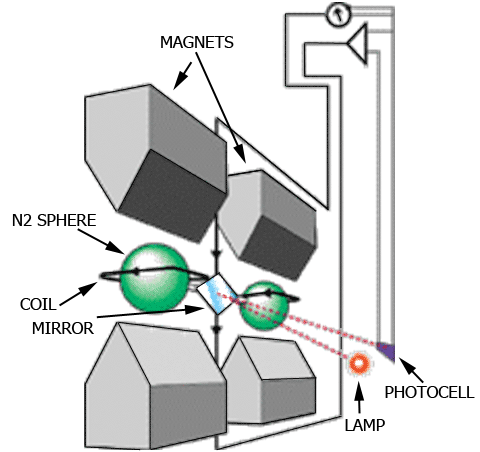
Paramagnetic Oxygen Analyzer Principle
Two nitrogen filled glass spheres suspended within a magnetic field.
Oxygen attracted into the magnetic field displaces the nitrogen filled spheres,
causing the suspension to rotate. A photocell converts the rotation to % O2.
Advantages:
• High stability and accuracy, fast and linear response.
• Non-depleting physical measurement, no chemicals to replace or renew.
• Insignificant effect from background gases.
Process requirements
– Percent oxygen levels only, failure at ppm levels.
- Maximum signal at maximum oxygen
– Sample conditioning is required - needs to be clean and dry
– No vibration of the instrument
General applications
– CEM systems
– Oxygen purity 90-100% range
– Area monitoring/safety/Air Quality
– Flue gas measurement with extensive sample conditioning
– Respirator Gas/Medical
Wet Electrochemical
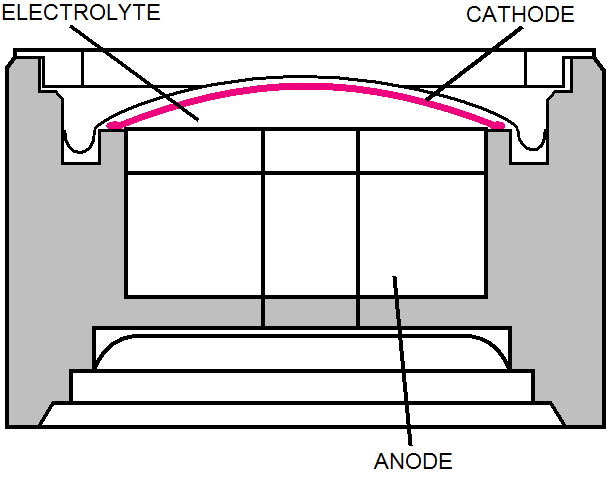
Wet Electrochemical
- Two electrodes in contact with an aqueous solution
- Oxygen molecules diffuse through a membrane to the
cathode where chemical reaction occurs
- Uses two electrons for the oxygen molecule to
release hyroxyl ions (OH-) to the electrolyte
- Anode, which is typically lead or cadmium
- Hyroxyl ions react with the anode material
- Oxidizes anode material and releases electrons
- Released electrons from anode are accepted by the cathode
- Cell becomes a battery with an electrical current that is
directly proportional to the flow of oxygen through the membrane
- Packaged in neat compact plastic cylinders
– Membrane
– Electrodes
– Electrolyte
• Throw away when anode material is depleted
• Light weight and requires only battery power
• Primarily used in portables
• Sampling conditioning system and cooling required
• Anode oxidizes rapidly when exposed to air
• Response is extremely slow in comparison to zirconium oxide cells
• Process requirements
– Low PPM oxygen levels with combustible backgrounds
– Sample gas needs to be clean and dry
– Sample conditioning required
• General applications
– Fermentation
– Battery operated systems - Portables
– Natural gas lines
– Volatile gas applications
– Personal Safety monitors
Zirconium Oxide

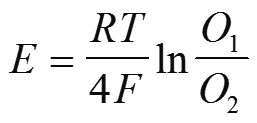
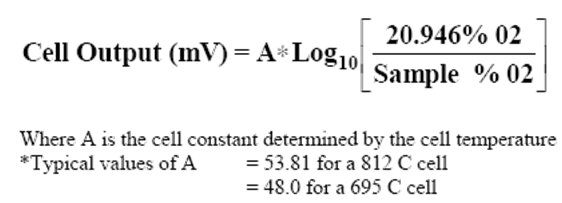
Nernst Equation
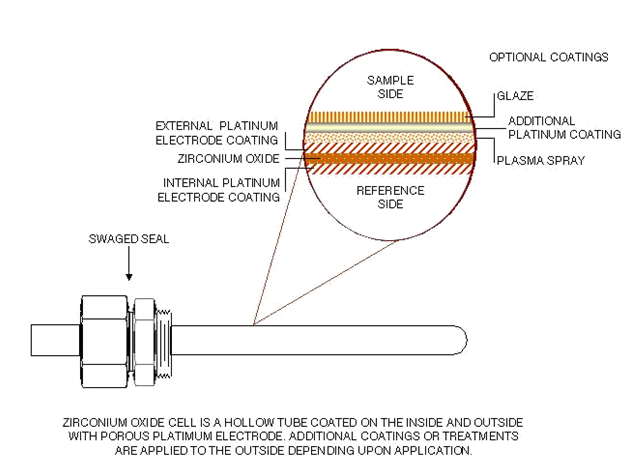
Zirconia Oxygen Cell Design
Zirconium Oxide Cell –Partial Pressure
• The Zirconium Oxide cell is a partial pressure device relating the partial pressure oxygen in air
(at atmospheric pressure) to a sample partial pressure oxygen (at process pressure).
• Normally the pressure of a sample is only inches (mm) of water pressure and the
error is minimal and the formula below gives the direct cell output.
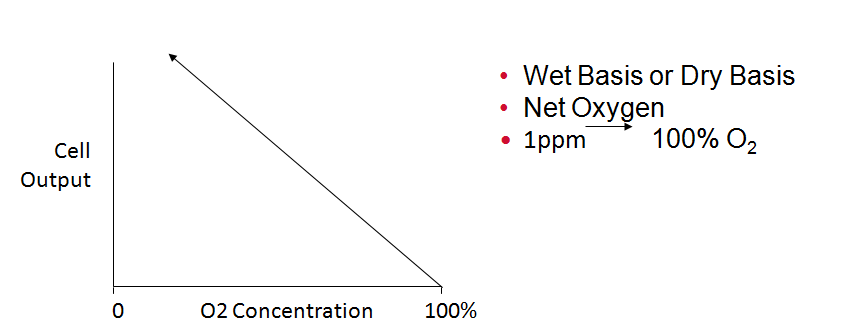
Zirconium Oxide Cell Description
• Provides net oxygen reading
– Combustibles will oxidize on surface of cell
– Net O2 after formation of H2O and CO2
• Provides wet measurement
– Lower value than dried sample
• Response Time: Less than 1 millisecond
• Reference air required
• Wide, Dynamic Range - Low PPM to Percent
• Field serviceable
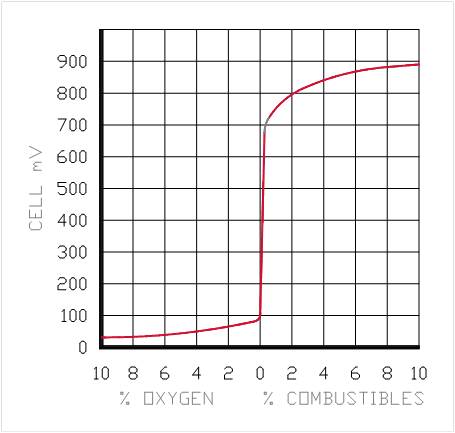
Zirconium Oxide Output on Linear Paper
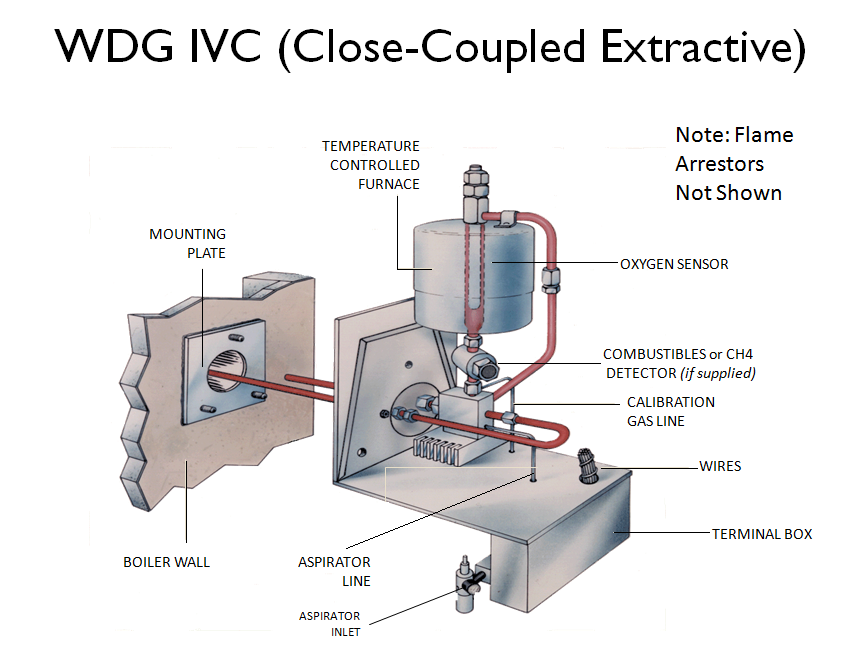
Zirconium Oxide Sensor can be used for Excess Air or Excess Fuel (Reducing) Applications
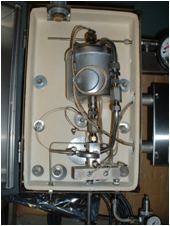
TEMPERATURE CONTROLLED FURNACE
pH measurement
1. An important measurement in many liquid chemical processes is that of pH.
2. The measurement of hydrogen ion concentration in a liquid solution.
3. A solution with a low pH value is called an "acid," while one with a high pH is called a "caustic."
4. The common pH scale extends from 0 (strong acid) to 14 (strong caustic),
with 7 in the middle representing pure water (neutral):
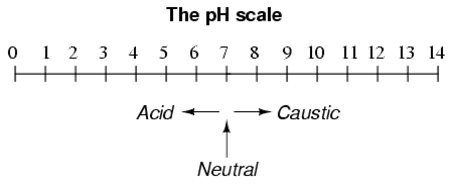
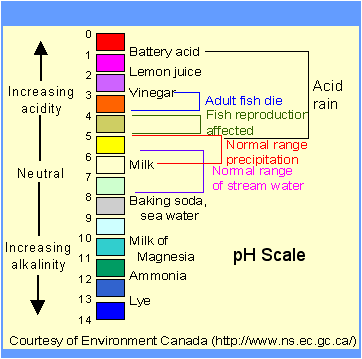
Pure water is neutral. But when chemicals are mixed with water,
the mixture can become either acidic or basic.
Examples of acidic substances are vinegar and lemon juice.
Lye and ammonia are examples of basic substances
The pH scale is logarithmic and as a result, each whole pH value
below 7 is ten times more acidic than the next higher value.
For example, pH 4 is ten times more acidic than pH 5 and 100 times
(10 times 10) more acidic than pH 6.
The same holds true for pH values above 7, each of which is ten times
more alkaline (another way to say basic) than the next lower whole value.
For example, pH 10 is ten times more alkaline than pH 9 and 100 times
(10 times 10) more alkaline than pH 8 pH can be measured by
color changes in certain chemical powders but continuous process
monitoring and control of pH requires a more sophisticated approach.
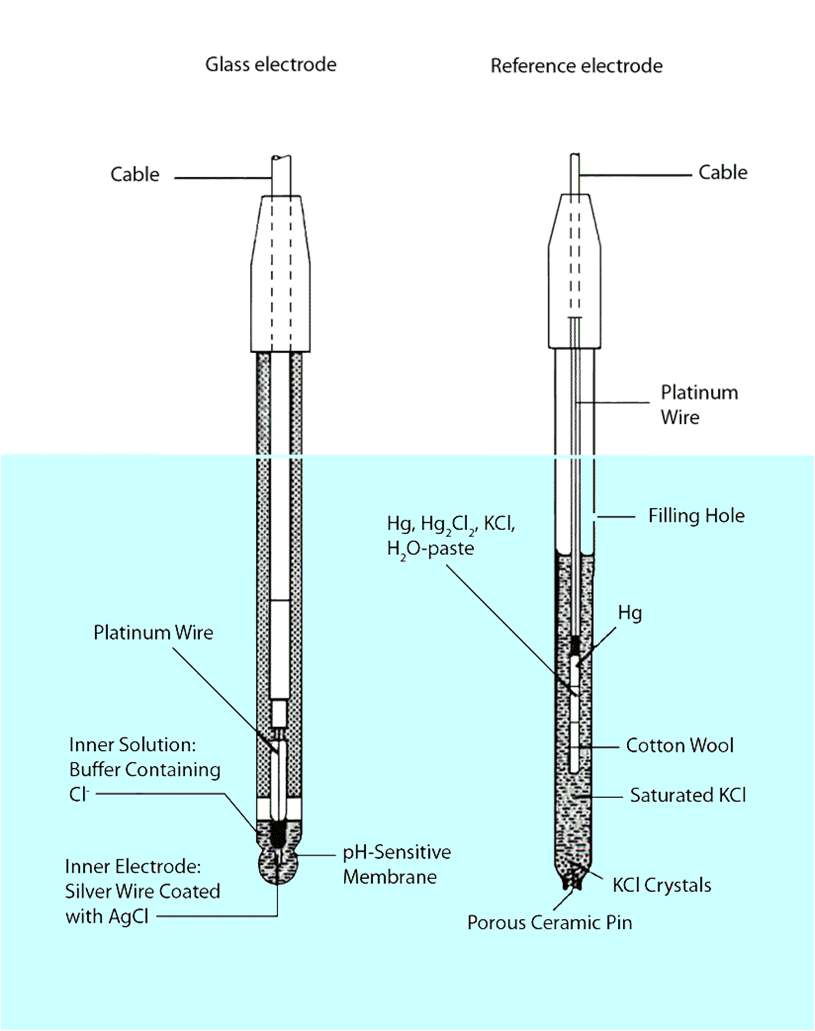
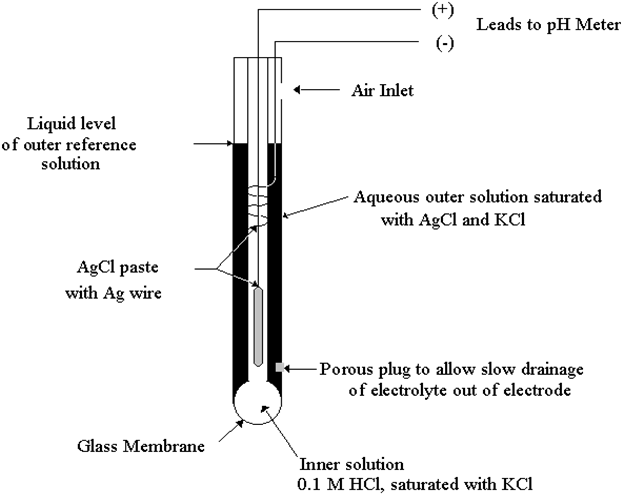
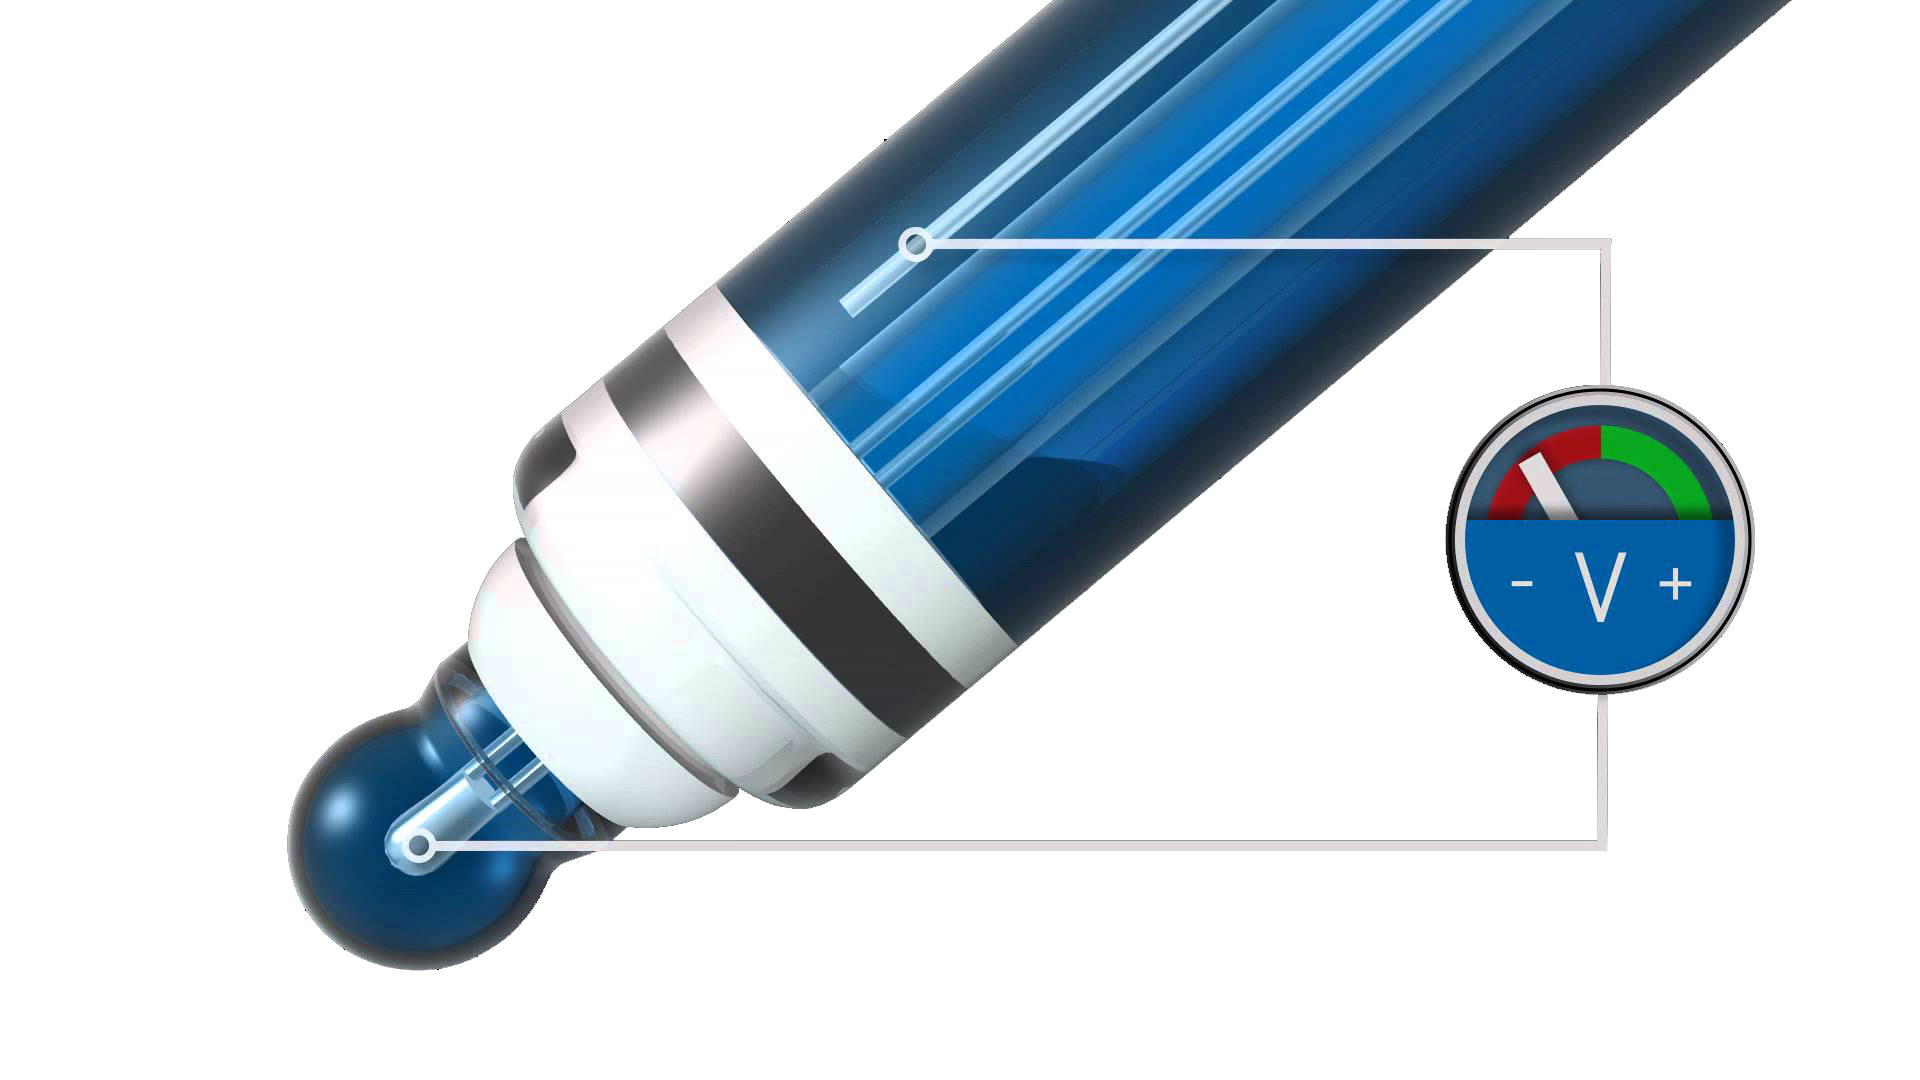
The most common approach is the use of a specially-prepared electrode
designed to allow hydrogen ions in the solution to migrate through a selective barrier,
producing a measurable potential (voltage) difference proportional to the solution's pH:
These two electrodes generate a voltage directly proportional to the pH of the solution.
At a pH of 7 (neutral), the electrodes will produce 0 volts between them.
At a low pH (acid) a voltage will be developed of one polarity,
and at a high pH (caustic) a voltage will be developed of the opposite polarity.
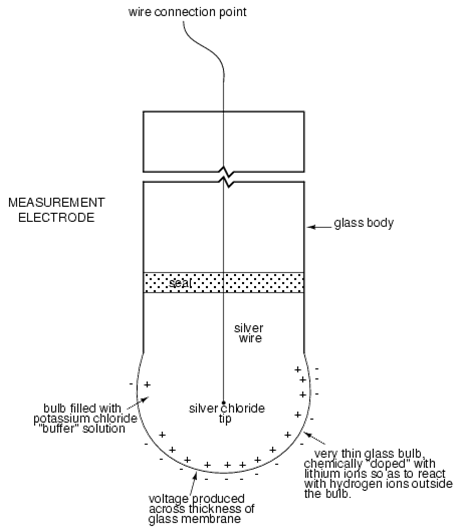
One of the pH electrodes (called the measurement electrode) must be
constructed of special glass which has extremely high resistance.
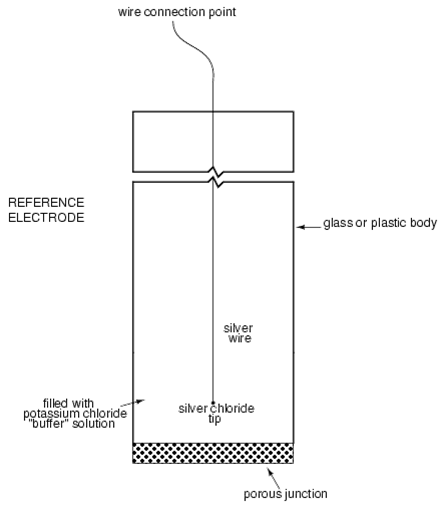
The reference electrode is made from a chemical solution of neutral (7) pH
buffer solution (usually potassium chloride) allowed to exchange ions with the process
solution through a porous separator, forming a low resistance connection to the test liquid.
1. All pH electrodes have a finite life, and that lifespan depends
greatly on the type and severity of service.
2. The glass (measurement) must generate the pH- proportional
voltage approximately 59 millivolts per pH unit
3. If a pH measurement system "drifts," creating offset errors,
the problem likely lies with the reference electrode,
which is supposed to provide a zero-voltage connection with the measured solution.
4. pH measurement is a logarithmic representation of ion concentration.
5. The following conditions are hazardous to measurement (glass) electrodes:
a. high temperatures,
b. extreme pH levels (either acidic or alkaline),
c. high ionic concentration in the liquid,
d. abrasion,
e. and any kind of material coating on the surface of the glass.
Temperature changes in the measured liquid affect the response of the
measurement electrode to a given pH level.
Temperature measurement devices can be inserted into the liquid, and the signals from
those devices used to compensate for the effect of temperature on pH measurement.
Inline Installation
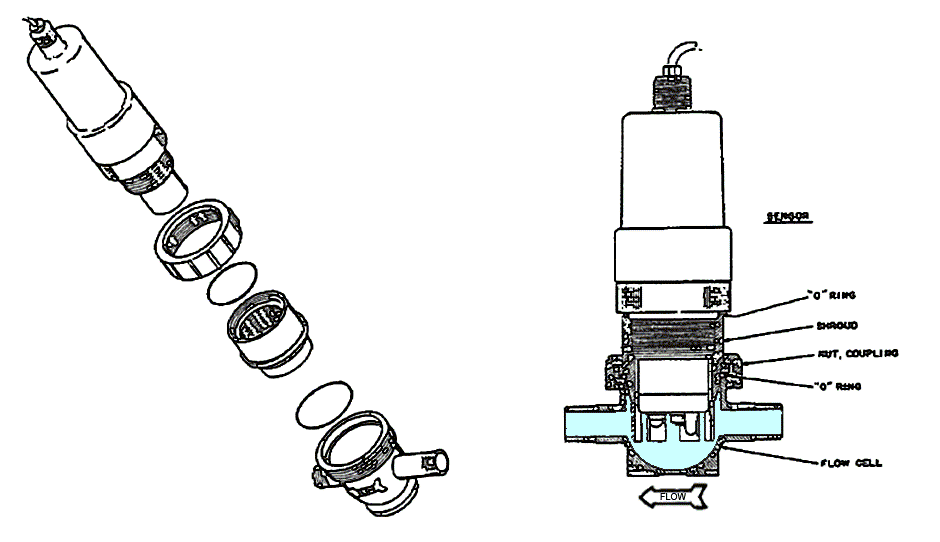
Flow Through Installation Diagram
What is Conductivity?
1. Conductivity is the ability of a material to transfer an electric charge
from one point to another.
2. Conductivity is the Reciprocal of Resistance
3. The units used from this property are Mhos (the reverse of Ohm )
or more commonly used Siemens.
Mhos and Siemens can be used interchangeably.
4. In a solution, the current flows by ion transport.
5. Therefore, an increasing concentration of ions in the solution will
result in higher conductivity values.
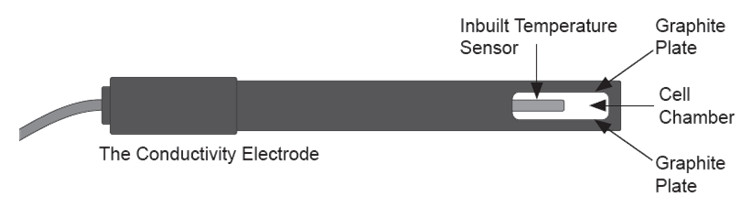
The probe is actually measuring conductance,
defined as the reciprocal of resistance.
Resistance is measured in ohms, conductance is measured in Siemens.
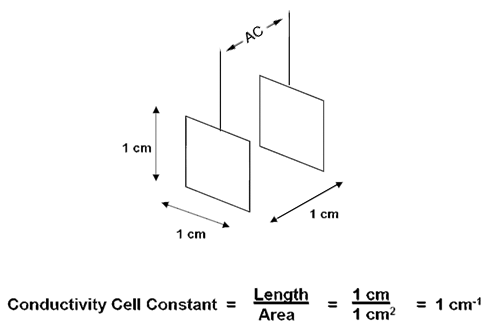
Conductivity C is found using the following formula: C = G * kC
G = conductance kC = cell constant
Salts, minerals, and even dissolved gases contribute
uniformly to the conductivity of a solution.
This means that the conductivity can be used as an
indicator of theTotal dissolved materials in a solution
|
CONDUCTIVITY
(u/SIEMENS-CM) |
RESISTIVITY
(OHMS-CM)
|
TOTAL DISSOLVED
SOLIDS (PPM) |
|
|
|
|
|
|
|
|
|
|
|
|
|
|
|
|
|
|
|
|
|
|
|
|
|
|
|
|
|
|
|
|
|
|
|
|
Continuous Emission Monitoring Systems (CEMS)
Monitor flue gas for primary pollutants such as: NOx and SO2, oxygen,
carbon monoxide, and carbon dioxide among other constituents of the exhaust stack.
• CEMS can consist of the following components:
– Analytical Monitoring system for gaseous pollutants
– Opacity/Particulate Monitoring System
– Flow Monitoring system
– Data Acquisition System
Gaseous Emissions
• Stack Gases represent the result of combustion or oxidation of
a hydrocarbon fuel - ex O2 + CH4
• The efficiency and type of combustion and the type of fuel being burned
results in different gases these always include:
– CO2 - direct result of combustion - not considered a pollutant unless
released in very large quantities (green house effect)
– H2O - direct result of combustion - steam is never a pollutant
– N2 - by product because of the air used in combustion - not a pollutant
– O2 - unburned oxygen - not a pollutant
Harmful Stack Emissions
• Incomplete Combustion result in emission of gases
which are harmful to the environment:
– CO - poisonous and combustible
– NOx - NO+NO2+NO3...etc - Poisonous and corrosive
– SO2(SOx) - only generated if Sulfur is present
– HC - unburned hydrocarbons resulting from incomplete combustion
– Particulate matter - measured as opacity (0-100% opaque) or particulate (mg/m3)
– Others such as ammonia are particular to the type
of process and fuel, these are not common
Stack Gas Analysis techniques
CEMS can be:
• “in-situ” (analyzer sensor is in direct contact with the gas in the stack)
• “extractive” (analyzer sensor is in contact with a sample of the gas
which has been withdrawn from the stack)
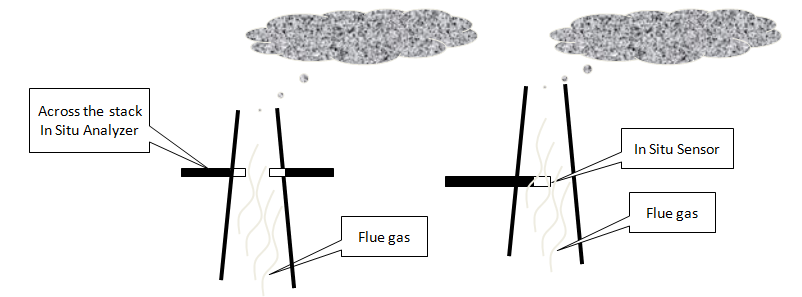
In-Situ = Wet
• Analytical sensor is part of a probe assembly and is direct
inserted into the stack OR an analyzer source and detector
are placed inside the stack and measure across the stack
• This type of measurement is inherently “wet” because there
is no way of removing the water from the flue gas
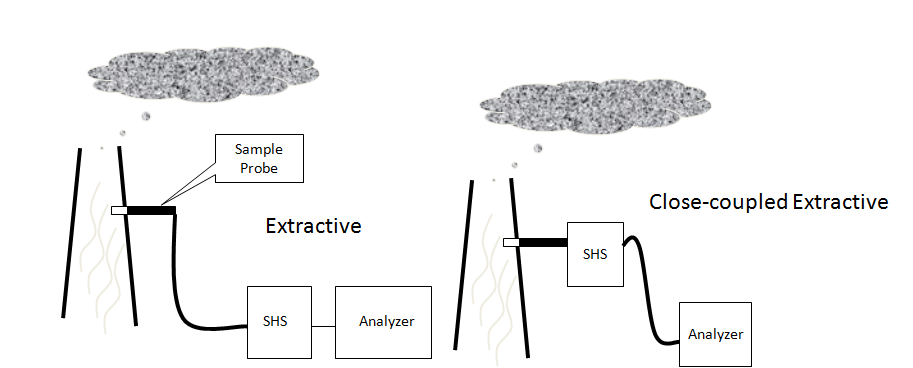
Extractive systems
Dust and Opacity Monitor
•Continuous, in situ measurement directly in the exhaust stream
without disruption or dust sampling.
•Semi-conductor light source
•Intensity of light decreases when amount of dust particles increases.
•Calibrated in mg/m³.
•Utilizes the principles of light transmission
•Correction for window contamination
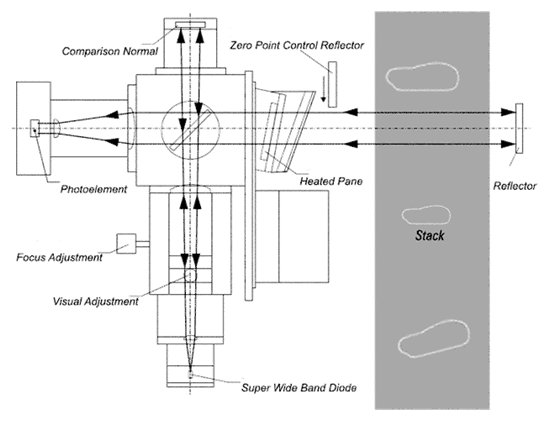
In Situ Dust and Opacity Monitor
The light beam from the emitter hits the dividing mirror,
goes to the reflector and bounces back to the receiver.
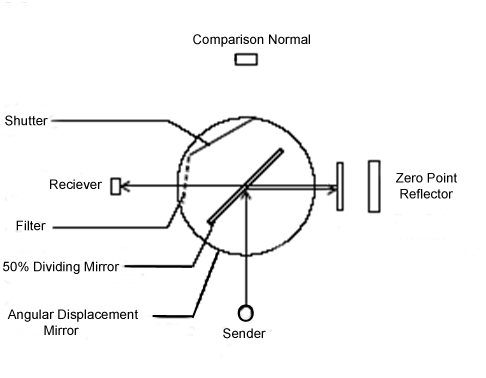
Calibration Check
The analyzer’s zero reference is determined using a Zero Point Reflector
Span is verified using an optical filter positioned in front of the receiver.
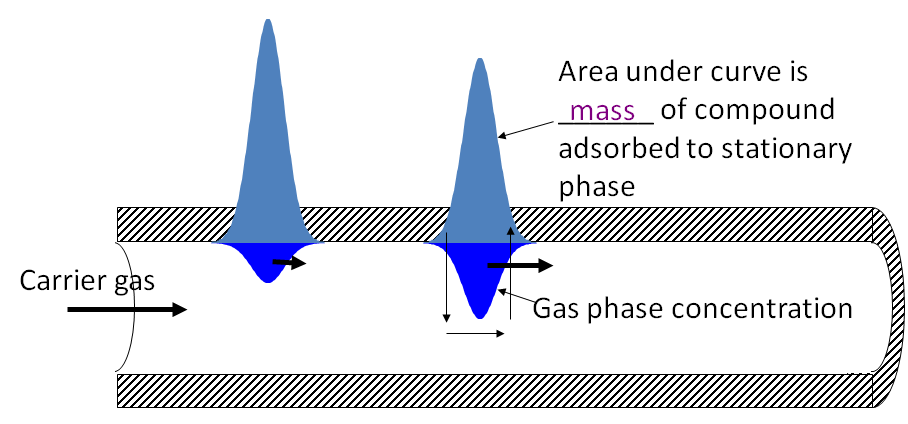
Process Gas Chromatography
Chromatography is a method for separating the components
of a mixture by differential adsorption between a stationary phase
and a mobile (moving) phase
Theory of Operation
• Velocity of a compound through the column depends
upon affinity for the stationary phase
Area under curve is mass of compound adsorbed to stationary phase
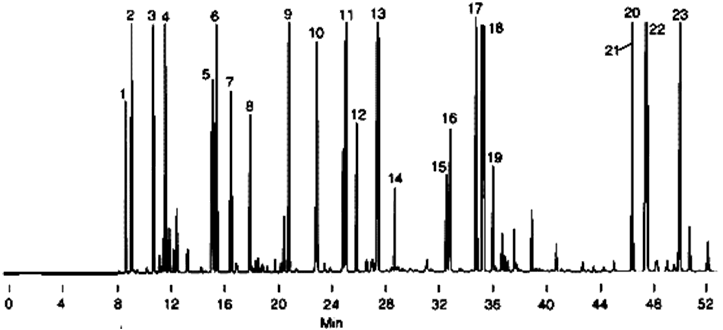
Chromatogram of Gasoline
1. Isobutane
2. n-Butane
3. Isopentane
5. 2,3-Dimethylbutane
6. 2-Methylpentane
7. 3-Methylpentane
8. n-Hexane
9. 2,4-Dimethylpentane
10. Benzene
11. 2-Methylhexane
12. 3-Methylhexane
13. 2,2,4-Trimethylpentane
14. n-Heptane
15. 2,5-Dimethylhexane
16. 2,4-Dimethylhexane
17. 2,3,4-Trimethylpentane
18. Toluene
19. 2,3-Dimethylhexane
20. Ethylbenzene
21. m-Xylene
22. p-Xylene
23. o-Xylene
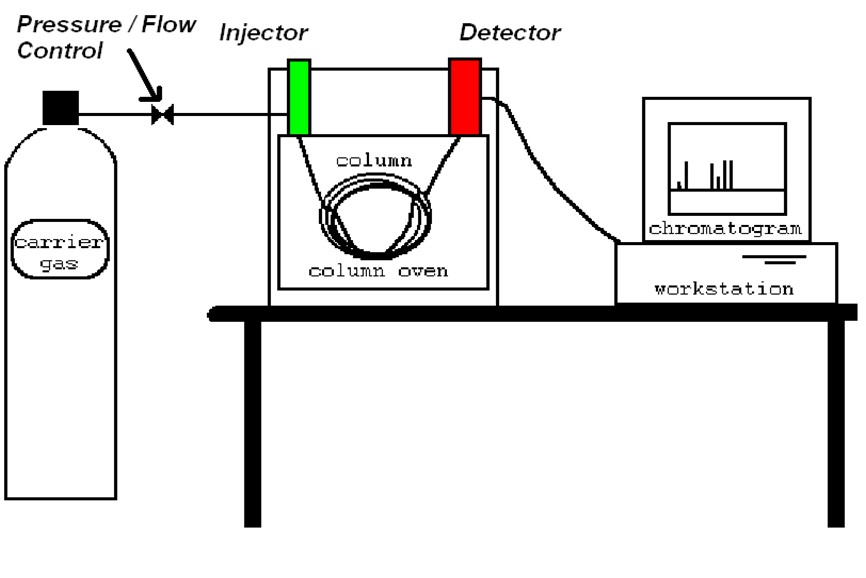
Basic Block Diagram
Separation Process
• Sample is introduced into system via hot, vaporising injector.
• Typically 1ul injected
• Flow of “Carrier Gas” moves vaporised sample (i.e. gas) onto column
• Column is coated with wax type material with
varying affinity for components of interest
• Components are separated in the column based on this affinity.
• Individual analytes are detected as they emerge from the end
of the column through the Detector.
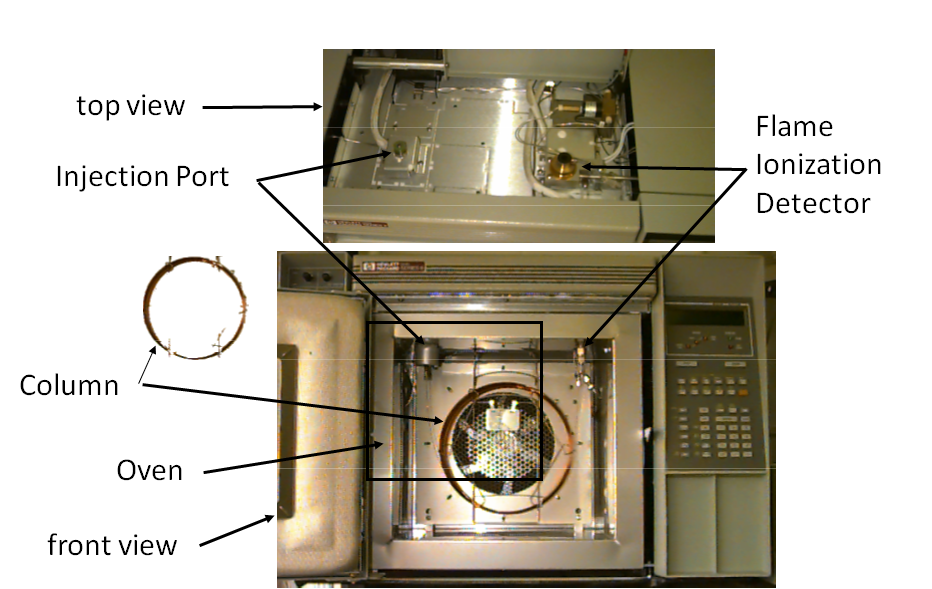
Gas Chromatograph Components
Types of Detectors
• Thermal Conductivity Detector
– Difference in thermal conductivity between the carrier gas
and sample gas causes a voltage output
– Ideal carrier gas has a very low thermal conductivity (He)
• Electron Capture Detector
– Specific for halogenated organics
• Flame Ionization Detector
Responds to compounds that produce ions when burned in an H2-air flame
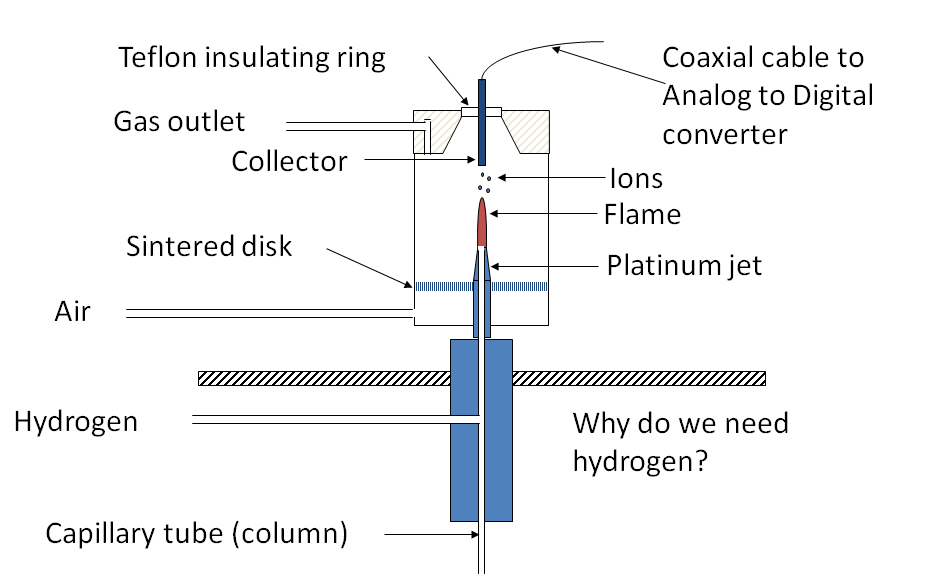
Flame Ionization Detector
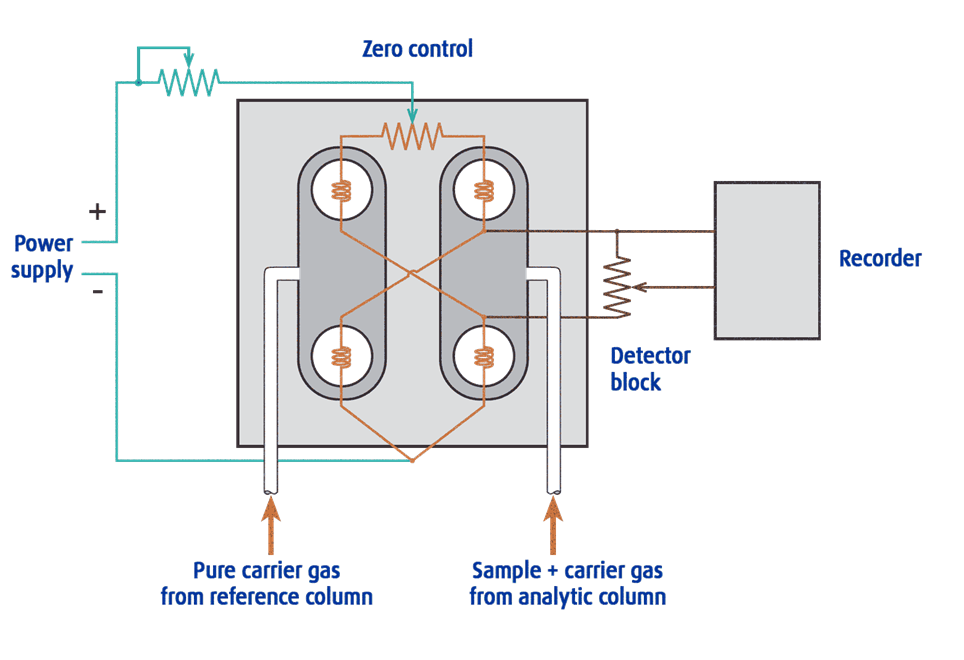
Thermal Conductivity Detector.
The Thermal Conductivity Detector (TCD) is truly a universal detector
and can detect air, hydrogen, carbon monoxide, nitrogen, sulfur oxide,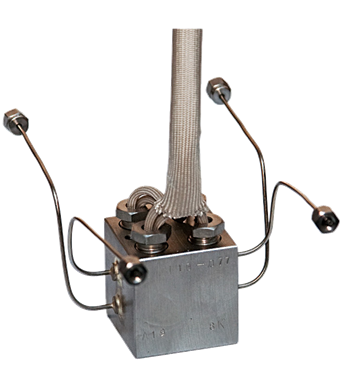
inorganic gases and many other compounds.
The TCD is a non-specific and non-destructive detector.
For most organic molecules, the sensitivity of the
TCD is lower compared to the Flame Ionization Detector (FID).
The TCD is based on the principle of thermal conductivity
which depends upon the composition of the gas.
The sample components in the carrier gas pass into the measuring channel.
A second channel serves as a reference channel where only pure carrier gas flows.
Electrically heated resistance wires are located in both channels.
The difference in thermal conductivity between the column effluent flow
(sample components in carrier gas) and the reference flow of carrier gas alone,
produces a voltage signal proportional to this difference.
The signal is proportional to the concentration of the sample components.
The connection of the heater wires where V out is zero when the resistance
is equal is called the Wheatstone Bridge
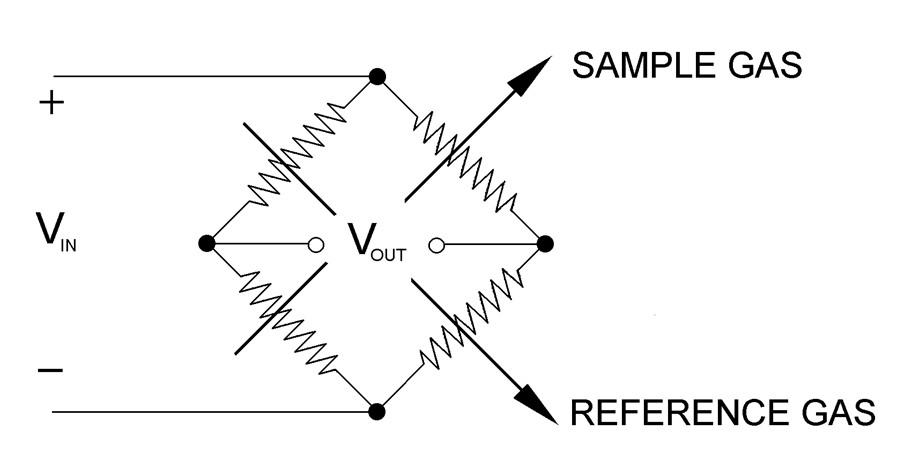
Wheatstone Bridge of the thermal conductivity detector
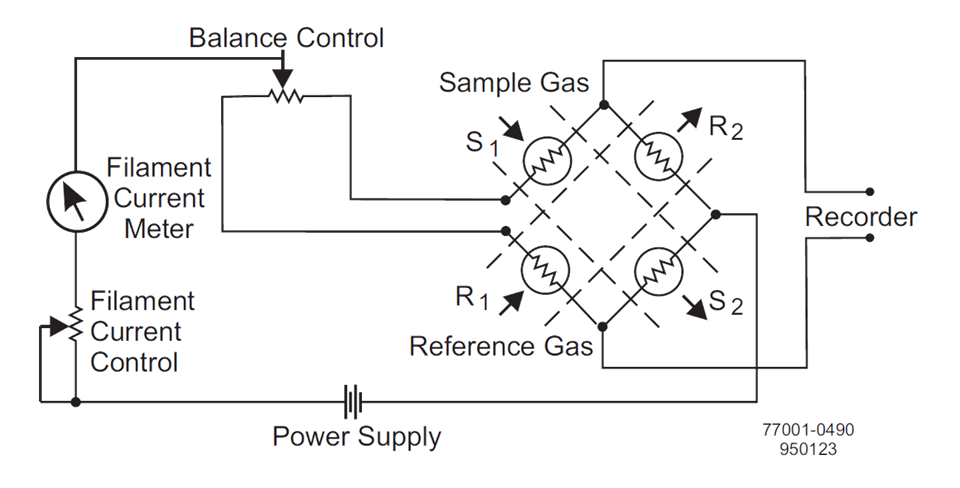
When all four resistances are the same, VOUT is zero and the bridge
is considered balanced. When zeroing, the reference gas is passed
over all the filaments, the resistances will be the same
(because filaments are matched) and the bridge is balanced.
When the sample gas is passed over half of the bridge, then VOUT’s
value correlates to the content of the sample gas in the reference.
Relative Thermal Conductivities of Typical Gas Components
(Specific Thermal Conductivities)
Type of Gas Value
|
Hydrogen H2
|
701
|
|
Helium He
|
599
|
|
Methane CH4
|
126
|
|
Oxygen O2
|
101
|
|
Nitrogen N2
|
100.3
|
|
Nitrogen monoxide NO
|
100.2
|
|
Air
|
100
|
|
Carbon monoxide CO
|
96
|
The relative values mentioned above were determined taking
thermal conductivity of air as 0.566 × 10⁴ (cal/cm.sec.deg) = 100 (at 0°C).
SPECTROMETERS
• Determines concentration of a substance in solution
– Measures light absorbed by solution at a specific wavelength
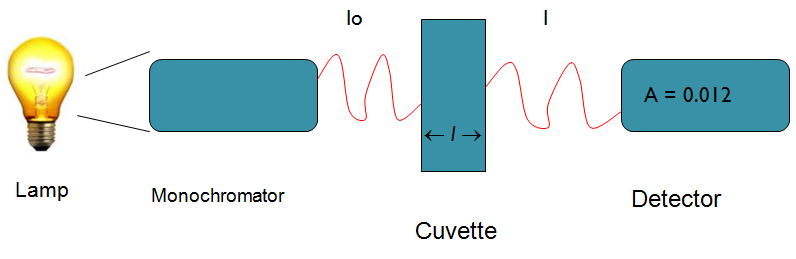
Spectrophotometry
Spectrophotometers
• Light source (Lamp)
• Optical filters or prism
• Tube or cuvette
• Photocell or photomultiplier tube
Light source (Lamp)
• Visible region = tungsten or tungsten-halogen
• UV light = deuterium or hydrogen lamp
Optical filters/prisms
• To limit light to a certain wavelength
• Monochromator can isolate a specific wavelength of white light
and allow it to pass through the solution being analyzed
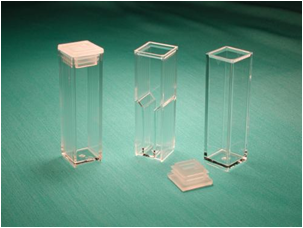
Tubes or cuvettes
• Visible range = glass cuvette
• UV range = quartz cuvette
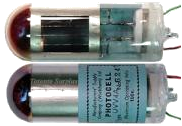
Photocell To detect transmitted light
Beer-Lambert’s Law
• The fraction of the incident light absorbed by a solution
at a given wavelength is related to
a. thickness of the absorbing layer (path length) and
b. concentration of the absorbing species
• Absorbance A = K x C = Log10 Io
l
Where: Io = amount of light absorbed by the solution
expressed as absorbance or optical density
K = constant
C = concentration of the substance
Visible region wavelength
|
Color
|
Wavelength (nm)
|
|
Ultraviolet
|
400 and under
|
|
Violet
|
400 - 450
|
|
Blue
|
450 - 500
|
|
Green
|
500 - 570
|
|
Yellow
|
570 - 590
|
|
Orange
|
590 - 620
|
|
Red
|
620 - 650
|
|
Infrared
|
750 & over
|
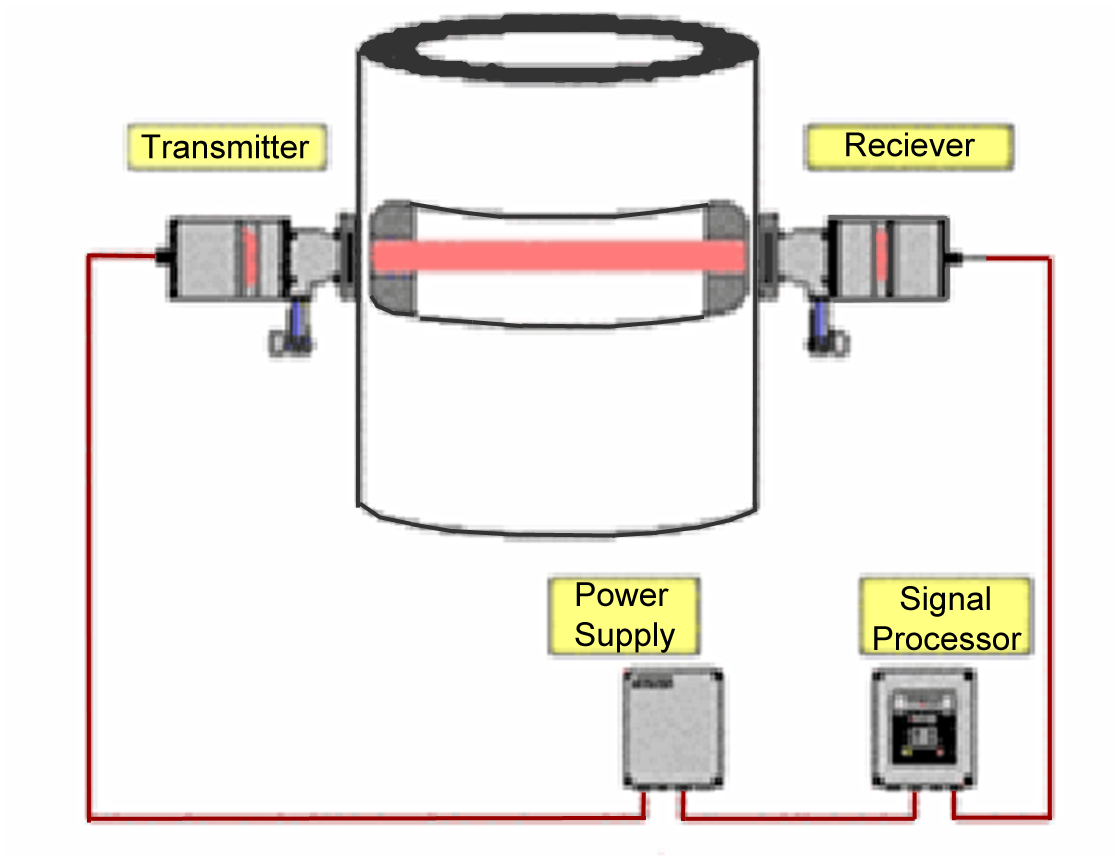
Infrared Absorption Spectroscopy
Infrared absorption spectroscopy is used to continuously measure
CO concentration in combustion flue gases.
Infrared energy is radiated by the source, through the flue gas,
to the receiver. The receiver employs gas filter correlation and narrow
bandpass optical filtration with a solid state detector
to determine the absorption of radiation by CO in the flue gas.
Carbon Monoxide (CO) Analyzer
Principles of Operation
Infrared energy, radiated by the source, passes through the
flue gas where a portion of the energy is absorbed by any CO present.
The remaining energy passes through the receiver window,
focusing lens and, alternate through two gas cells.
These two cells, one filled with CO and the other with nitrogen,
are inserted alternately in the optical path at a fixed frequency
Why Measure CO?
– Boiler operating costs are reduced with the aid of
a continuous carbon monoxide (CO) measurement
– Attempts to reduce NOx by reducing available oxygen
can also potentially increase unburned fuels
– An increasing CO reading while the flue gas O2 is
being controlled at its setpoint means the burners need maintenance;
combustion efficiency is on the decrease and fuel usage is on the increase.
– The continuous measurement of CO can save hundreds
to thousands of dollars per day because the boiler’s air/fuel ratio
can be set to lower fuel consumption and heat loss
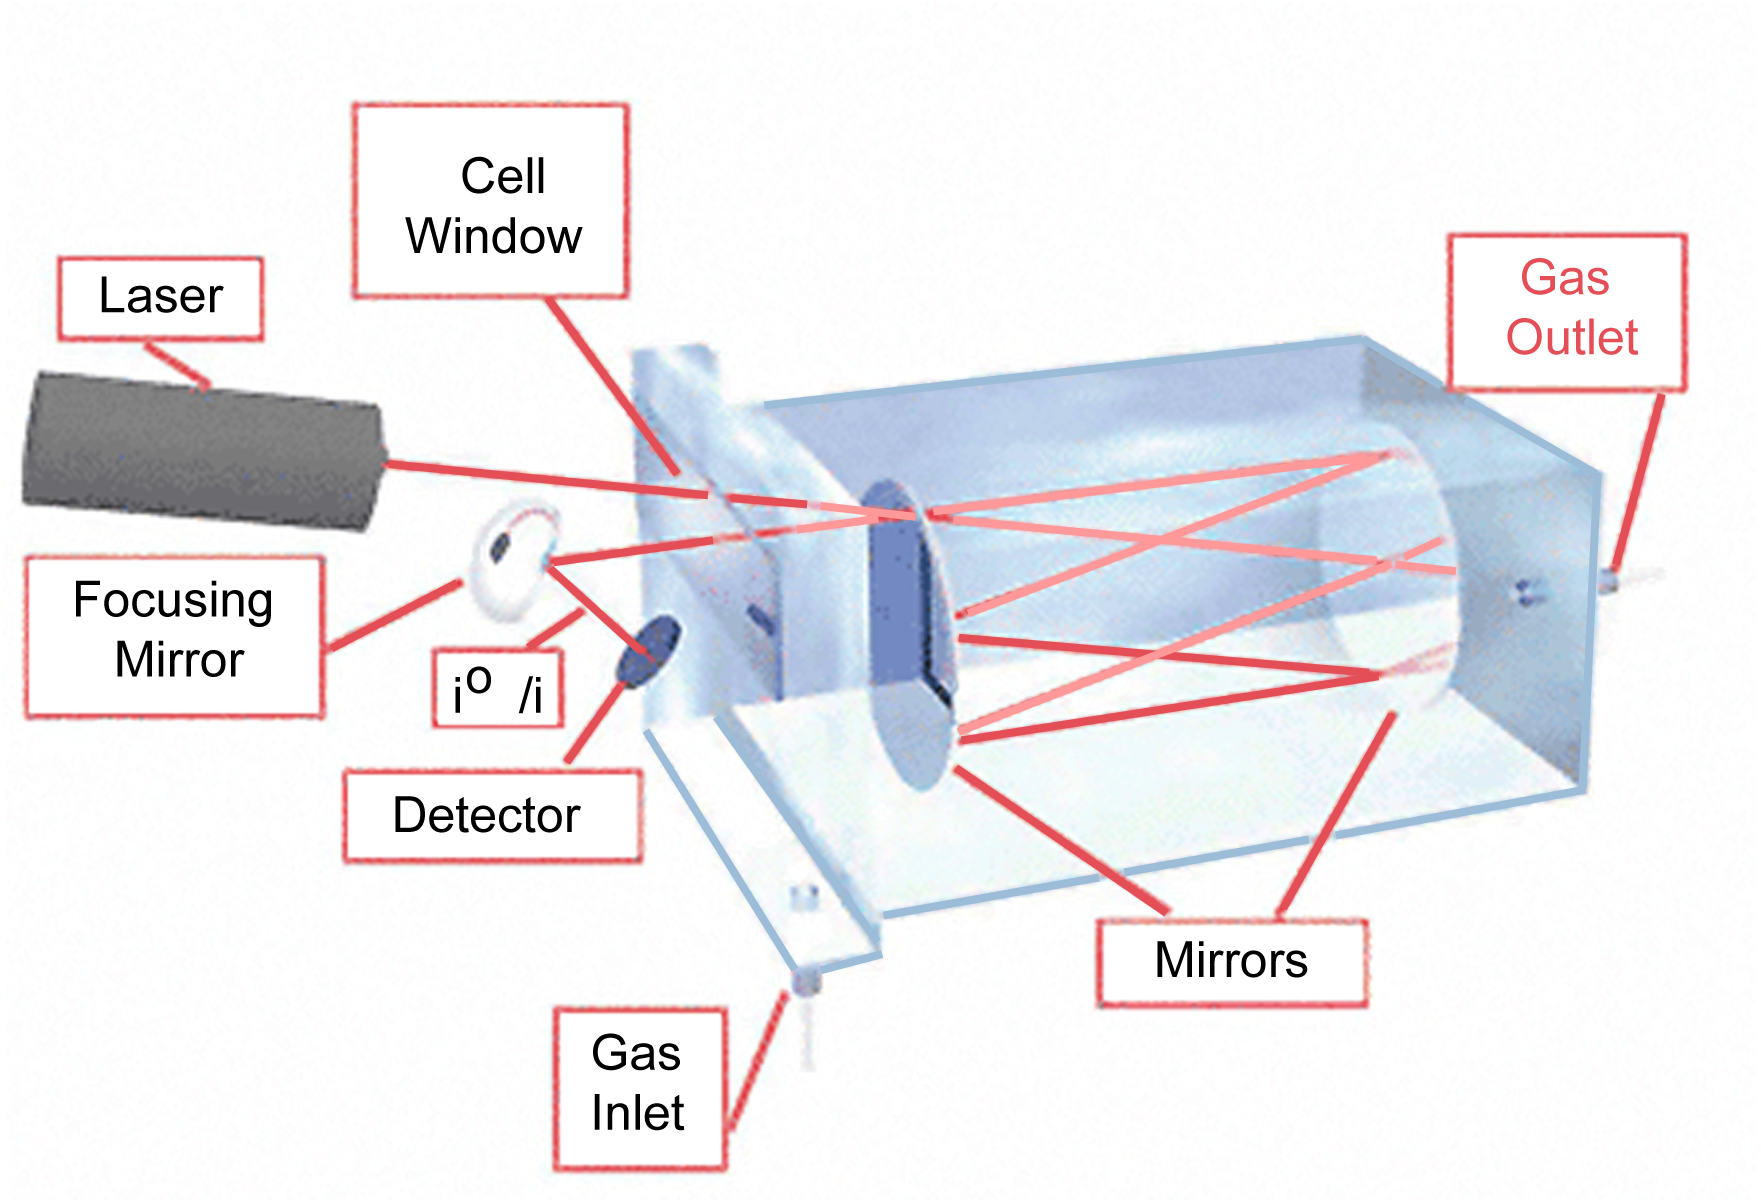
Tunable Diode Laser Absorption Spectroscopy
(TDLAS) is a technique for measuring the concentration of methane,
water vapor and many more, in a gaseous mixture.
Using tunable diode lasers and laser absorption spectrometry,
very low detection limits (of the order of ppb) are achieved.
TDLAS is by far the most common laser based absorption technique
for quantitative assessments of species in gas phase.
Beer's Law is:
I is the measurement of beam intensity when tuned
to the absorbing wavelength of moisture
Iº is the reference measurement or beam intensity when
tuned away from the moisture absorbing wavelength
S is the fundamental absorption line strength and is
a fixed constant L is the path length
of the beam through the sample and is a fixed constant
N is the number of water molecules contained in the beam path
passing through the sample
What is Density?
Density is a measurement of the proximity of the molecules
that make up a substance.In simplest in simplest terms,
density is a mass per unit volume.
The symbol most often used for density is ρ (the Greek letter)rho 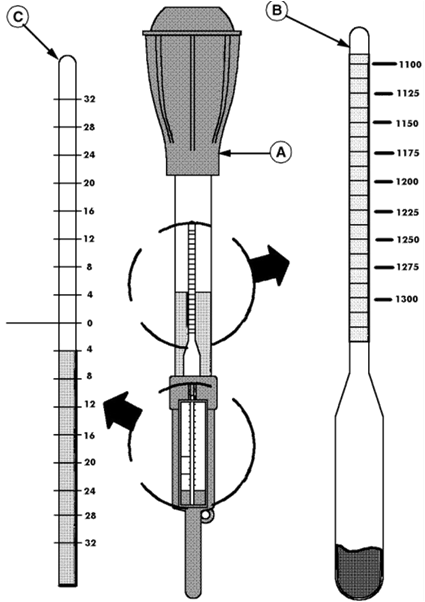 Density Formula: Density = M/V
Density of Water = 1000 kg/m3
Density of Water @ 60 Deg. F: 62.33630 lb/ft3 or 1000 kg/m3
Density of Air @ 14.696 psia and 60 Deg. F 0.0764 lb/ft3
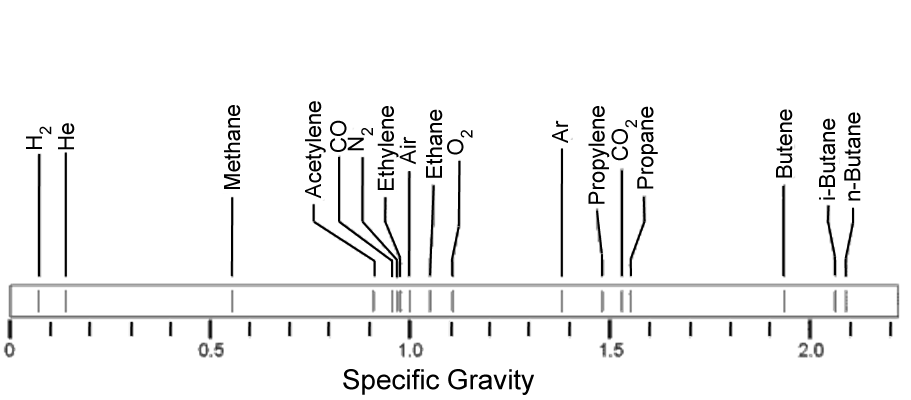
What is Specific Gravity?
Another term commonly used to express the density of fluid is
Specific Gravity (S.G.) and is defined as a ratio comparing the
density of fluid at specific temperature to the density
of water or air at the same temperature.
S.G.= Density of a liquid
Density of water or air at standard conditions.
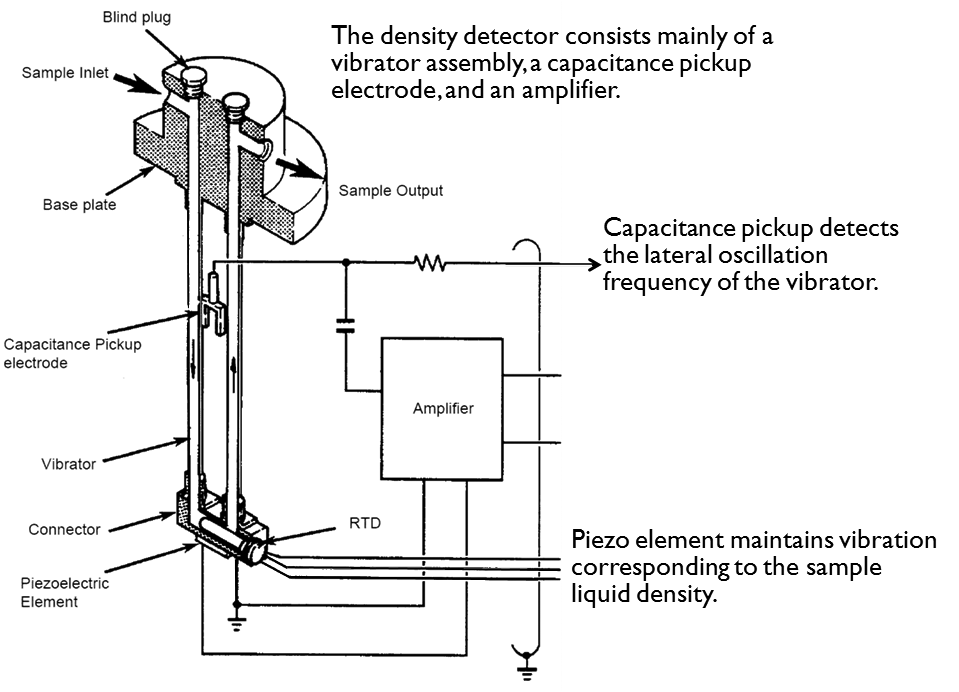
Density Measurement
With changes in concentration of liquid the density varies.
The velocity of sound in water is 1483m/s (at 20° C).
Many solutions show a change of velocity of sound depending
on concentration between 1200m/s and 1800m/s.
For a distance between ultrasonic transceiver and receiver of 2 cm
this gives delays between 10us and 20us.
Application
The state-of-charge of a lead acid battery can be determined by
the specific gravity of the electrolyte (its weight compared to water).
The specific gravity can be measured directly with a hydrometer
A hydrometer is a bulb-type syringe which will
extract electrolyte from a battery cell.
A glass float (B) in the hydrometer barrel is calibrated
to read in terms of specific gravity. The range of specific gravity
used on these floats is 1.140 to 1.325.
Specific Gravity of Common Gases
Gas Density Meter Applications:
- Fiscal / Custody transfer gas metering
- Energy management systems
- Stack emissions analysis and control
- LNG metering and control
- Calorific value estimation
- Specific gravity measurement
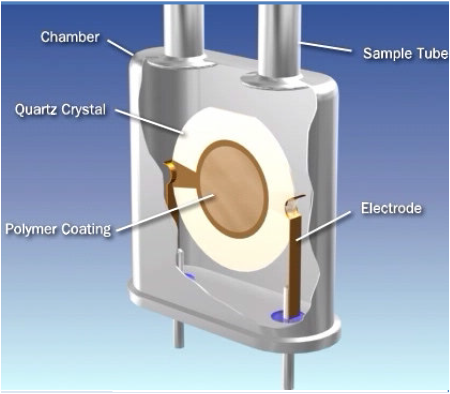
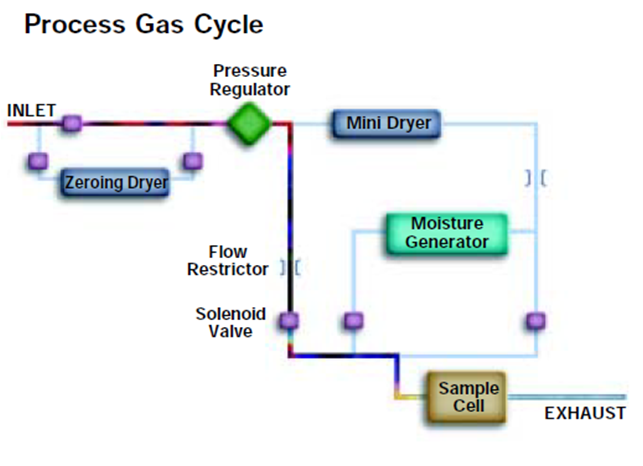
THE QUARTZ-CRYSTAL SENSOR
The sensor consists of a quartz-crystal disc coated with a hygroscopic polymer.
As the amount of moisture absorbed onto the polymer varies, the mass of the QCM
changes producing a corresponding change in the frequency of oscillation.
During the process gas cycle moisture molecules
accumulate on the surface of the QCM sensor.
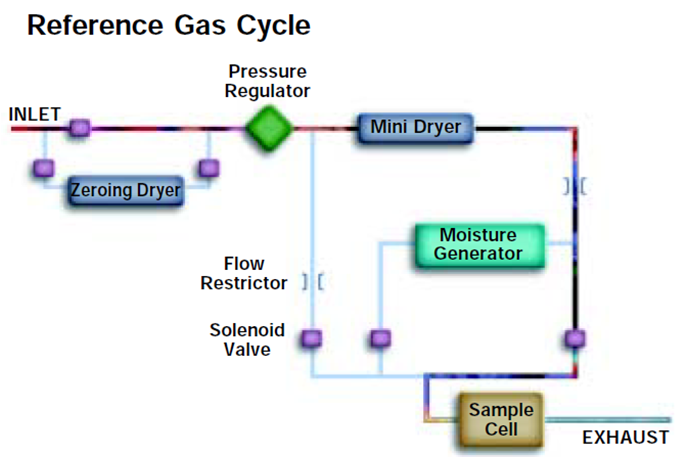
During the reference gas cycle these water molecules are swept off
the surface of the sensor by the dry gas flow. The difference in the
oscillation frequency between the process and reference gas cycle
is converted to moisture indication
 Moisture Analyzer.png)
Electrolytic (P2O5) Moisture Analyzer
The surface of the sensor is coated with phosphoric acid (P2O5).
With the sensor maintained under a DC potential, the P2O5 serves as
a hygroscopic substrate for the absorption and electrolysis of water molecules.
The water molecules entering the cell are converted into hydrogen and oxygen,
and the electrolysis current required for the conversion is measured.
Moisture analyzers that use electrolytic sensors are typically small and light enough
to be portable. Performance on sample streams containing hydrogen or oxygen is poor.
Specifically, the hydrogen and oxygen formed in the electrolysis of water entering
the sensor can react with the corresponding gas in the sample to form more water.
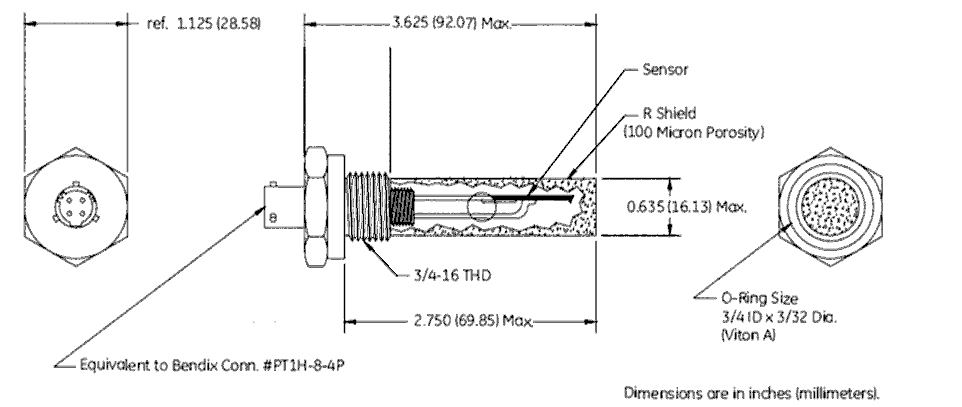
Aluminum Oxide Moisture Probe
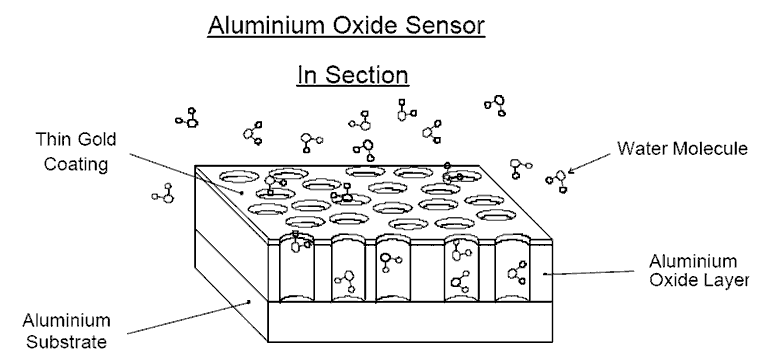
The holes in the Aluminium Oxide are just large enough for the
water molecule to enter, but too small for just about anything else.
As water molecules enter, the dielectric value of the sensor increases-
the more water, the greater the capacitance. The amount of water molecules
in the oxide layer is directly proportional to the partial water vapour pressure
in the gas/liquid being analysed.
Main Applications
Measurement of Water Vapor
Hydrocarbon Dew-Point in Natural Gas
Instrument Air Dew Point
Routine Maintenance of Analyzer Systems
1. Analyzer walk-through inspection and maintenance (Daily Rounds).
2. Changing Compressed Gas Cylinders
3. Opening cabinet and compartment doors to view various
components of analyzer systems associated with analyzer buildings.
4. Sample System maintenance in or around analyzer buildings.
5. Replacing filters.
6. Maintaining sample pumps.
7. Maintaining or replacing valves inside analyzers and sampling
systems in or around analyzer buildings.
8. Utilizing data acquisition systems, PLC’s, and other related systems
in analyzer buildings to monitor variables.
9. Lining up calibration standards.
10. Calibration.
1. Analyzer walk-through inspection and maintenance
(Daily Rounds)
Making daily rounds consists of going out to each analyzer
both inside analyzer buildings and any other analyzer equipment
not connected to an analyzer building for the purpose of
checking and making minor adjustments.
a. Verify that the analyzers and other analyzer related
equipment are functioning properly.
b. Check and clear alarms.
c. Make minor adjustments to flow, pressure, temperature
and other related variables to maximize analyzer performance.
d. Inspect all other related equipment connected
with the analyzer for proper function.
e. Inspect and replace all associated filters as necessary
f. Check compressed gas cylinders and regulators, change as needed
2. Changing Compressed Gas Cylinders
This applies to the changing of compressed gas cylinders of all analyzer
systems whether they are associated with analyzer buildings or not
3. Opening cabinet and compartment doors to view various
components of analyzer systems associated with analyzer buildings.
This includes analyzers, alarm systems, junction boxes which do not contain
live switching devises, sample systems and other related analyzer
equipment inside analyzers buildings.
4. Sample System maintenance in or around analyzer buildings
Sample system maintenance would include the repairing, adjusting or replacing
of filters, flow meters, and other related components within the sampling system.
5. Replacing filters
Replacing filters includes any filters not in the sample system that are in or around
and associated with an analyzer either inside or outside the analyzer building.
There must be local isolation valves to isolate the filter from the energy source.
6. Maintaining sample pumps
Sample pumps include: vacuum pumps, peristaltic pumps or other related analyzer pumps.
There must be local valves to isolate the process before working on these pumps.
If the pump does not have local isolation valves to block the energy source,
contact operations to obtain the appropriate lockout / tagout
and process isolation to secure the process tap.
7. Maintaining or replacing valves inside analyzers and sampling systems
This may be sample valves, column valves, stream switching valves, SSO, ARV,
or other related analyzer valves both inside the analyzer building and outside.
There must be local valves to isolate the process and/or other energy sources
before working on any parts that come in contact with the process.
If the valve does not have local isolation valves to block the energy source,
must contact operations to obtain the appropriate lockout / tagout
and process isolation to secure the process tap.
8. Utilizing data acquisition and other systems in
analyzer buildings to monitor variables.
This includes checking for and clearing alarms, making minor adjustments
to optimize analyzer performance, initiating calibrations, and other related
monitoring and adjustment features.
9. Lining up calibration standards
This includes blocking process and opening valves to allow
calibration standard to flow through the analyzer.
This would include replacing calibration cylinders
10. Calibration
This includes viewing chromatograms or other maintenance diagnostic tools,
adjusting factors and other related adjustments to perform this task.
OVERHAUL OF ANALYZERS
1. Overhaul and repair of Analyzers is carried out in line
with the manufacturers instructions.
2. All spares used during overhaul and repair comply
with the manufacturers specifications.
3. The overhaul and repair work is carried out by Instrument Technicians
and recorded by the repairer. Work on ANALYZERS is recorded in the Analyzer Database.
4. Test equipment used is calibrated and certified by an approved
Calibration Laboratory as recommended by BPS
TEST EQUIPMENT
1. Test equipment is registered in the Analyzer Database by tag number
along with makers’ identification details, calibration details and calibration frequency.
2. Calibration and certification is carried out by a Calibration Laboratory specified by
BPS. The calibration certificates are filed in the Workshop Library.
The calibration requests are generated by the Analyzer Database.
3. Some of the test equipment is installed on workbenches,
in air-conditioned workshops. Portable test equipment is stored
in cupboards also in air-conditioned workshops.
All test equipment is identified by a tag number and the last calibration
ANALYZER VALIDATION METHODS
Analyzers are validated using one of the four methods detailed below.
A) A test standard generated by a certified sample-generator.
B) Samples of known composition complete with
a certificate of analysis from the supplier.
C) A test sample taken from a gas bottle that is
accurately analyzed (multiple tested) by the laboratory.
D) A single test done in the laboratory on a sample
taken from the same streamas the on-line analyzer.
DEFINITIONS
Accuracy is the ability of a measuring instrument to give a
true indication of the value of the quantity measured
Analyzer (process analyzer) is an instrument to measure continuously
and automatically a quality property of a process stream.
Availability is the portion or percentage of the total time
that an analyzer system is functioning correctly.
Availability rate (A), is the period of time during which
the analyzer is at users disposal and in operating condition.
Bias of a measurement is the relation to a consistent
or systematic differencebetween a set of test results from the process and an
Breakdown rate (B) is the period of time during which the analyzer
is not working due to failure, breakdown and subsequent repair.
Checking rate (C) is the period of time during which the analyzer
is not available to operations for reasons of checking, calibration,
periodic inspection and planned maintenance.
TBRK is the period of time in hours during which the analyzer
was not available for reasons of instrument breakdown.
TCHK is the period of time in hours during which the
analyzer was not available to operations for reasons of checking,
calibration, periodic inspection and planned maintenance.
TPRO is the period of time in hours the process unit is operational.
Warning limit (WL) indicates the performance of an analyzer.
Test results falling continuously outside the warning limit indicate systematic errors.
Control limit (CL) is an indication of the performance of an analyzer.
Test results outside control limit indicate malfunctioning of equipment.
On-line analyzer is an analyzer operating on a sample of the
process fluid withdrawn continuously from the process line via a sampling system.
In-line analyzer is an analyzer in which the measurement sensor
is located within the process line or vessel, e.g. density meter,
pH meter, oxygen meter etc. Such analyzers do not require
a sampling system and are of the continuous type.
Reliability is the ability of equipment to perform a required function
under given conditions for a stated period of time, expressed quantitatively
as the mathematical probability of its performance under these conditions.
Repeatability of measurement is a quantitative expression
of the closeness of agreement between the results of successive
measurements of the same value of the same quantity carried out
by the same method, by the same observer, with the same
measuring instrument at the same location, separated by short intervals of time.
Repeatability of a measuring instrument is the quality
that characterizes the ability of a measuring instrument to give
identical indications, or responses, for repeated applications of the
same value of the measured quantity under stated conditions of use.
Reproducibility is a general term for a measure of precision applicable
to the variability between single test results obtained in different laboratories
using test specimens taken at random from a single sample of material.
Reproducibility rate (R) is the period of time during which the analyzer
is operating within the reproducibility limits of the relevant standard
Response time of an analyzer, is the time that elapses after
a step change in the measured variable at the analyzer input
up to the point at which the instrument gives an indication equal
to the expected indication corresponding to the new value of the measured
variable, or not differing from this by more than a specified amount.
ANALYSER VALIDATION AND REPORTING
Apart from routine checking, analyzers are subjected to
regular validation checks by running standard samples through
the instruments and recording the results on standard report formats.
Validation
An analyzer validation check is initiated by the analyzer maintenance technician.
The validation test results are included and processed in individual reports.
Calibration
A calibration check has a similar function to a validation check,
however an added feature is available. The technician is able to use the
validation results to adjust the output of the analyzer.
Data storage is provided on hard disk for long-term storage
data tables used for reporting, validation, calibration and statistical data.
Validation criteria for analyzers
For analyzers there are two sets of limits,
the warning limit (WL) and the control limit (CL).
The warning and control limits are derived
from the accuracy specification of the analyzer.
The WL is taken as 2 times the standard deviation.
The CL is set at 3 times the standard deviation.
Test results obtained, within the WL,
will give a satisfactory analyzer performance.
It should be noted that the average of test results depends
upon the calibration standard set, an inaccurate standard can
easily result in a wrong interpretation of the WL and CL.
CONTROL OF TEST GAS CYLINDERS
Test gases are specified and ordered from suppliers certified to ISO 9002.
Gas mixtures are prepared on a gravimetric basis and
are provided with a certificate of composition..
Test gas cylinders have a unique number stamped
on the body of the cylinder for identification.
This number is also given on the certificate.
One copy of the certificate of composition is attached to the cylinder.
An extra copy is made and filed in the appropriate
Area where the cylinder is put to use.
VALIDATION OF pH ANALYSERS
This procedure must be executed on a weekly basis:
1. Clean the probe, flush well with distilled water.
2. Fill the electrode assembly with buffer solution.
The Buffer lot number shall be indicated
on the bottle of the Buffer used to do the validation.
3. Allow the analyzer reading to stabilize.
4. Record the analyzer reading,
the value of the buffer solution, and the time.
5. Empty the electrode assembly and restore normal sample flow.
6. Enter the validation result in the Analyzer Database.
7. Ensure that there are no statistical
quality control alarms resulting from the validation.
VALIDATION OF GAS CHROMATOGRAPHS
This work instruction must be executed on a twice weekly basis.
1. Ensure that the standard span gas cylinder is
lined up to the sample conditioning system.
2. Open the calibration gas valve on
the sample conditioning system.
3. Open calibration gas valve on analyzer.
4. Turn sample selection valve to the "calibration gas" position.
5. Ensure that the calibration sample pressure at the analyzer
is 0.2 bar with a flow reading of 30 cc on analyzer flow meter.
6. Allow calibration gas to purge analyzer for a minimum time of 5 minutes.
7. Start an analysis cycle from GC.
8. Note the readings.
10. Turn sample selection valve to the "process gas" position.
11. Close calibration gas valve on analyzer.
12. Close calibration gas ball valve on sample conditioning system.
13. Enter the validation result and any
maintenance done in the Analyzer Database.
Benjamin S. Valle email:
calmansys@yahoo.com
 Analyzer.png)